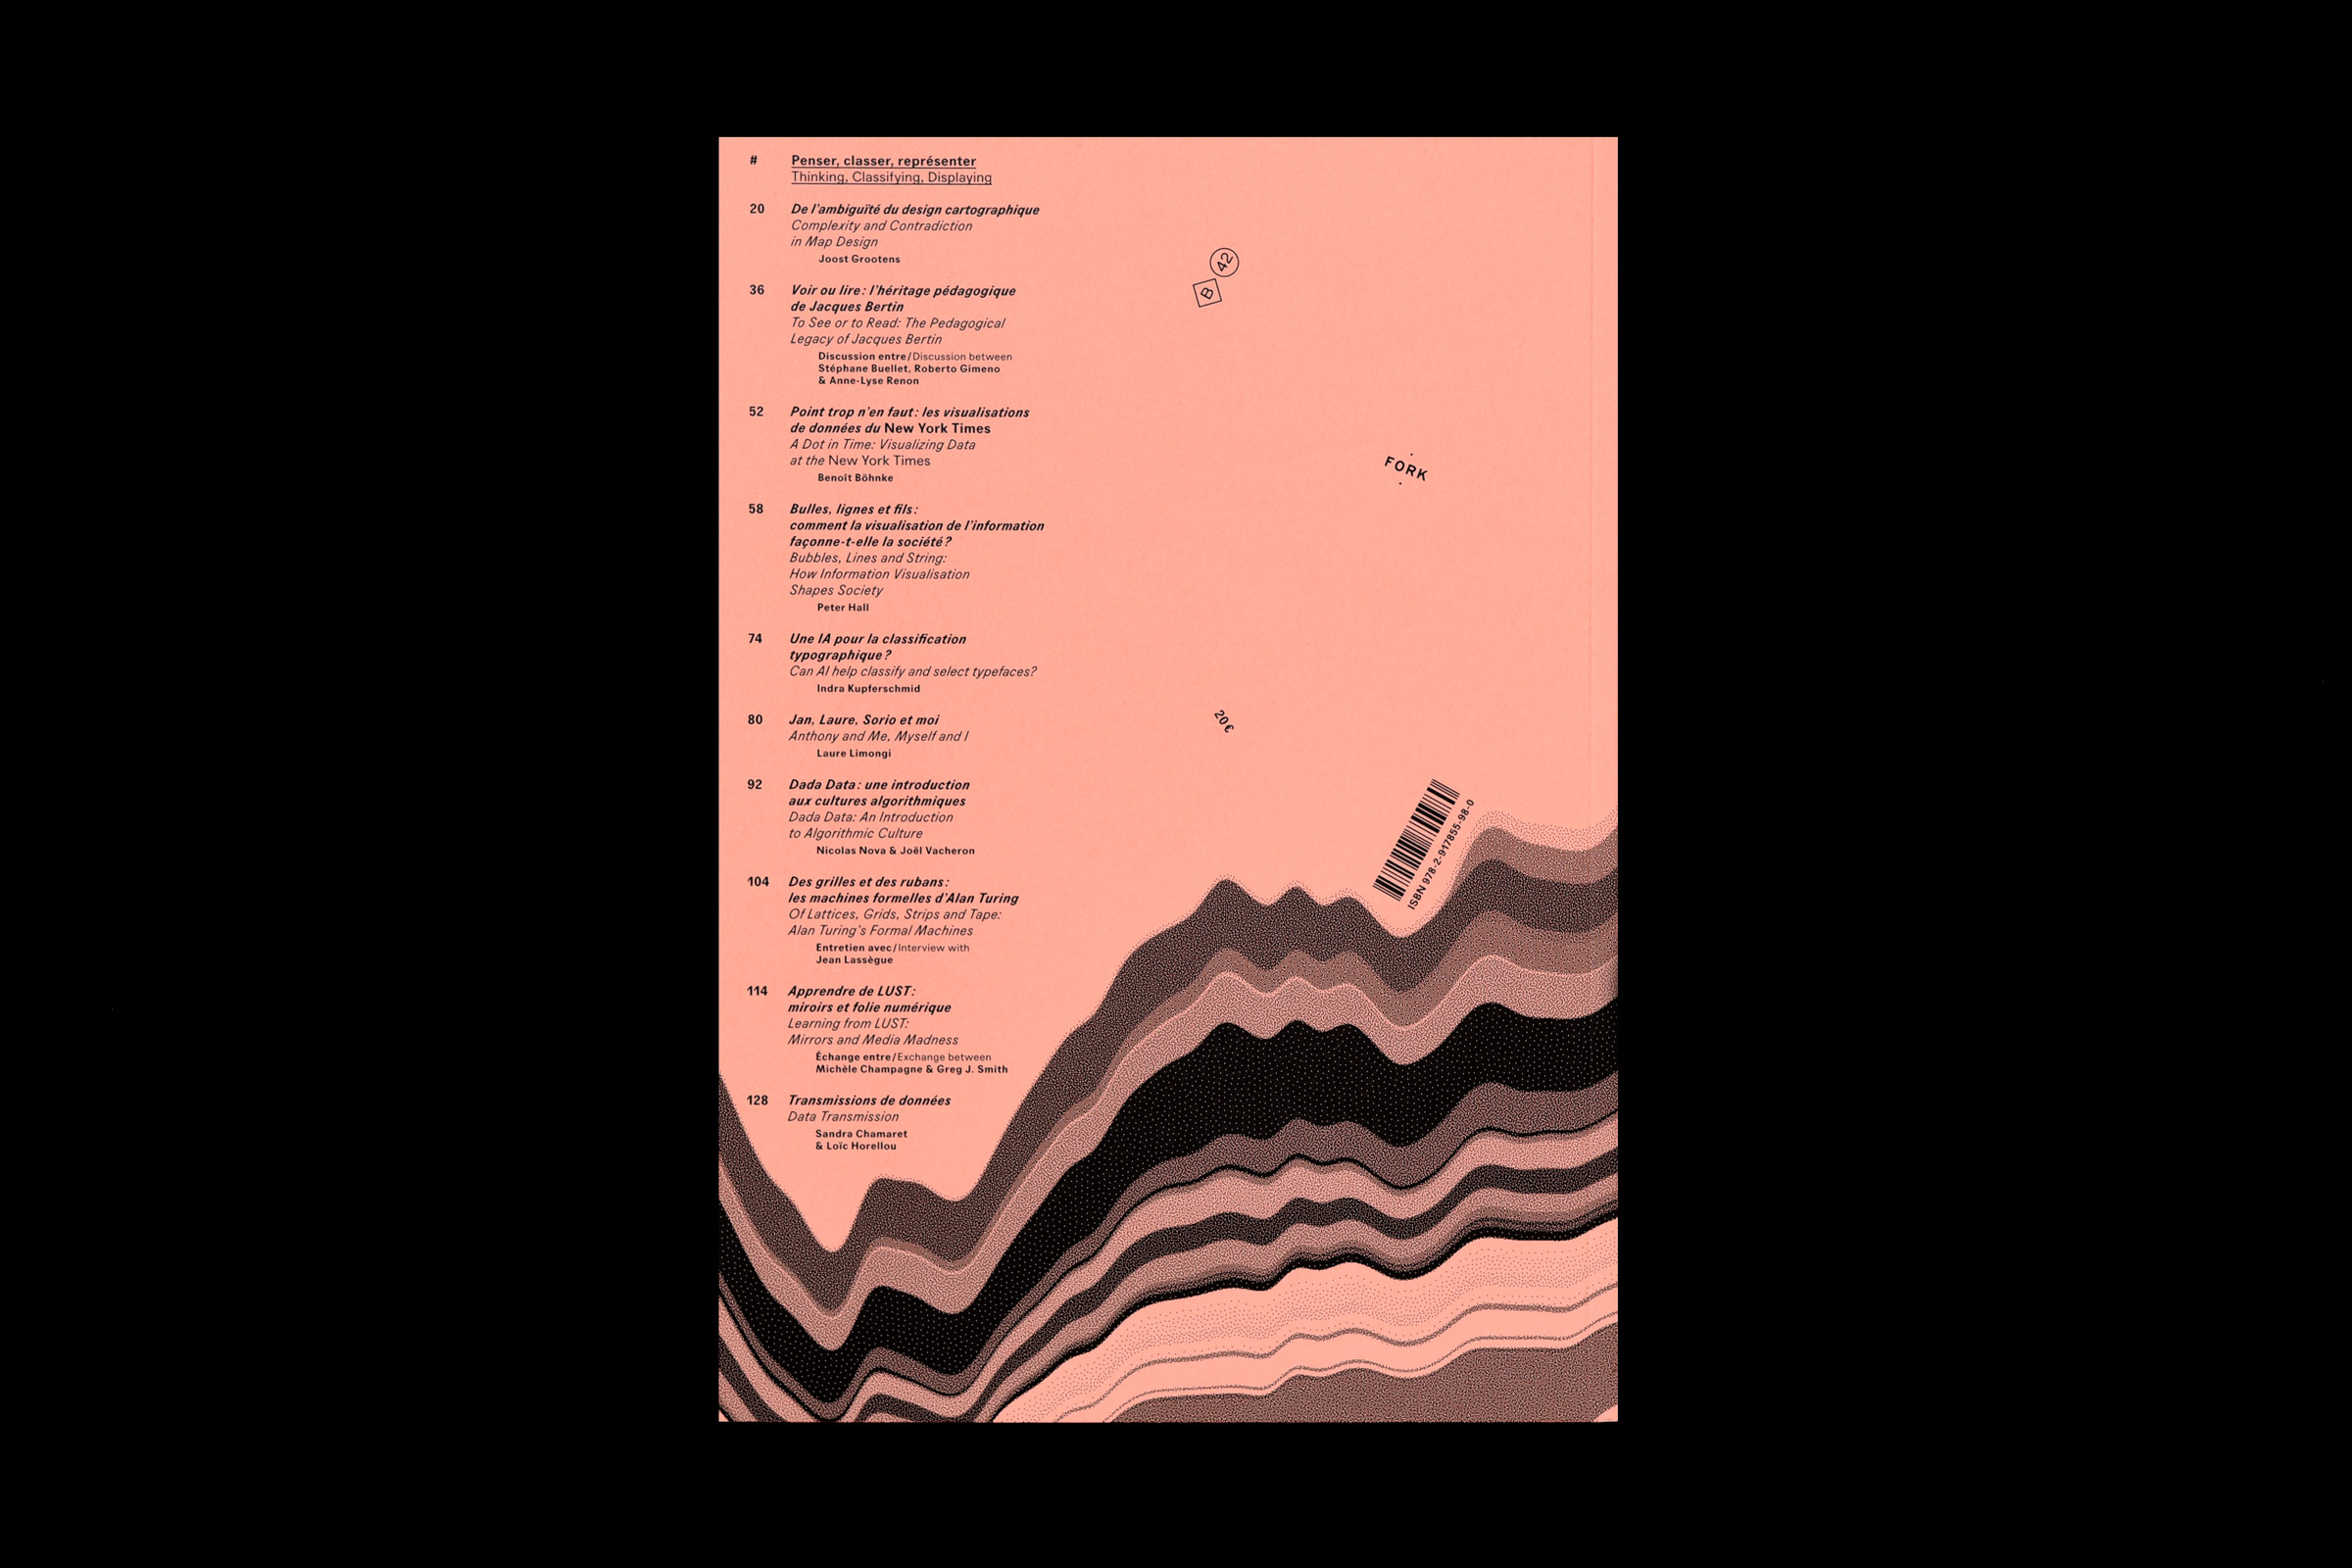
SOMMAIRE
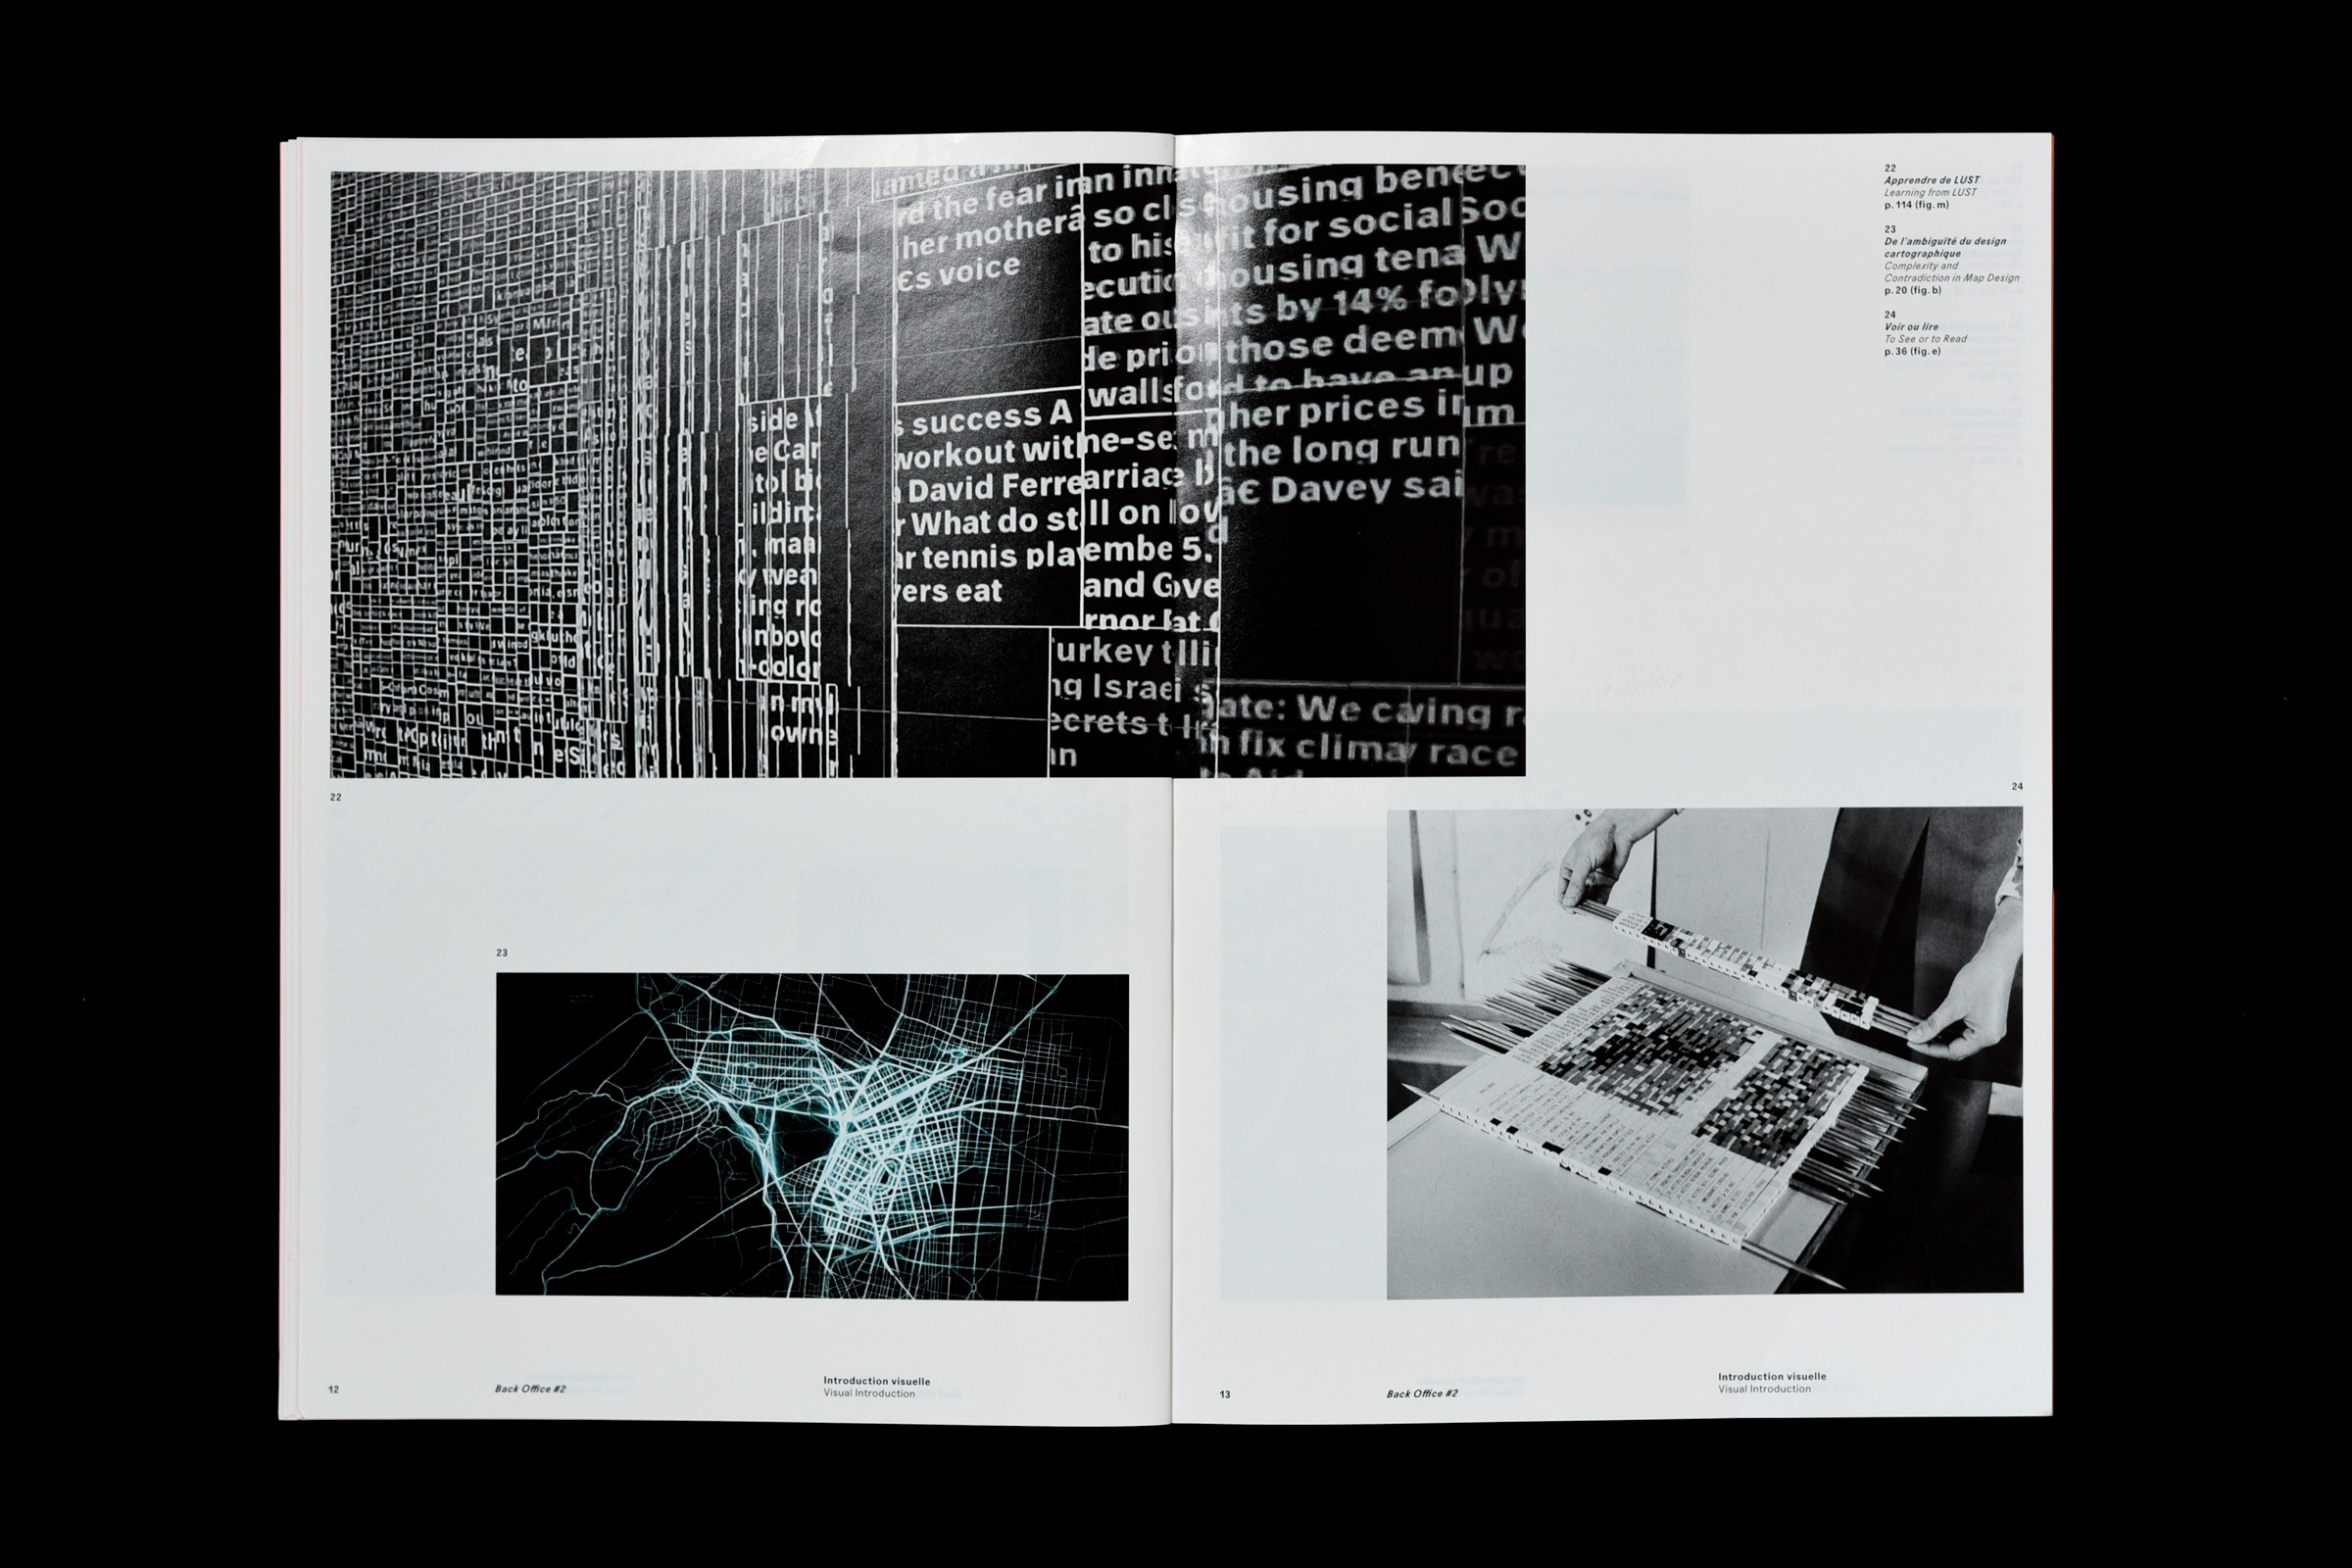
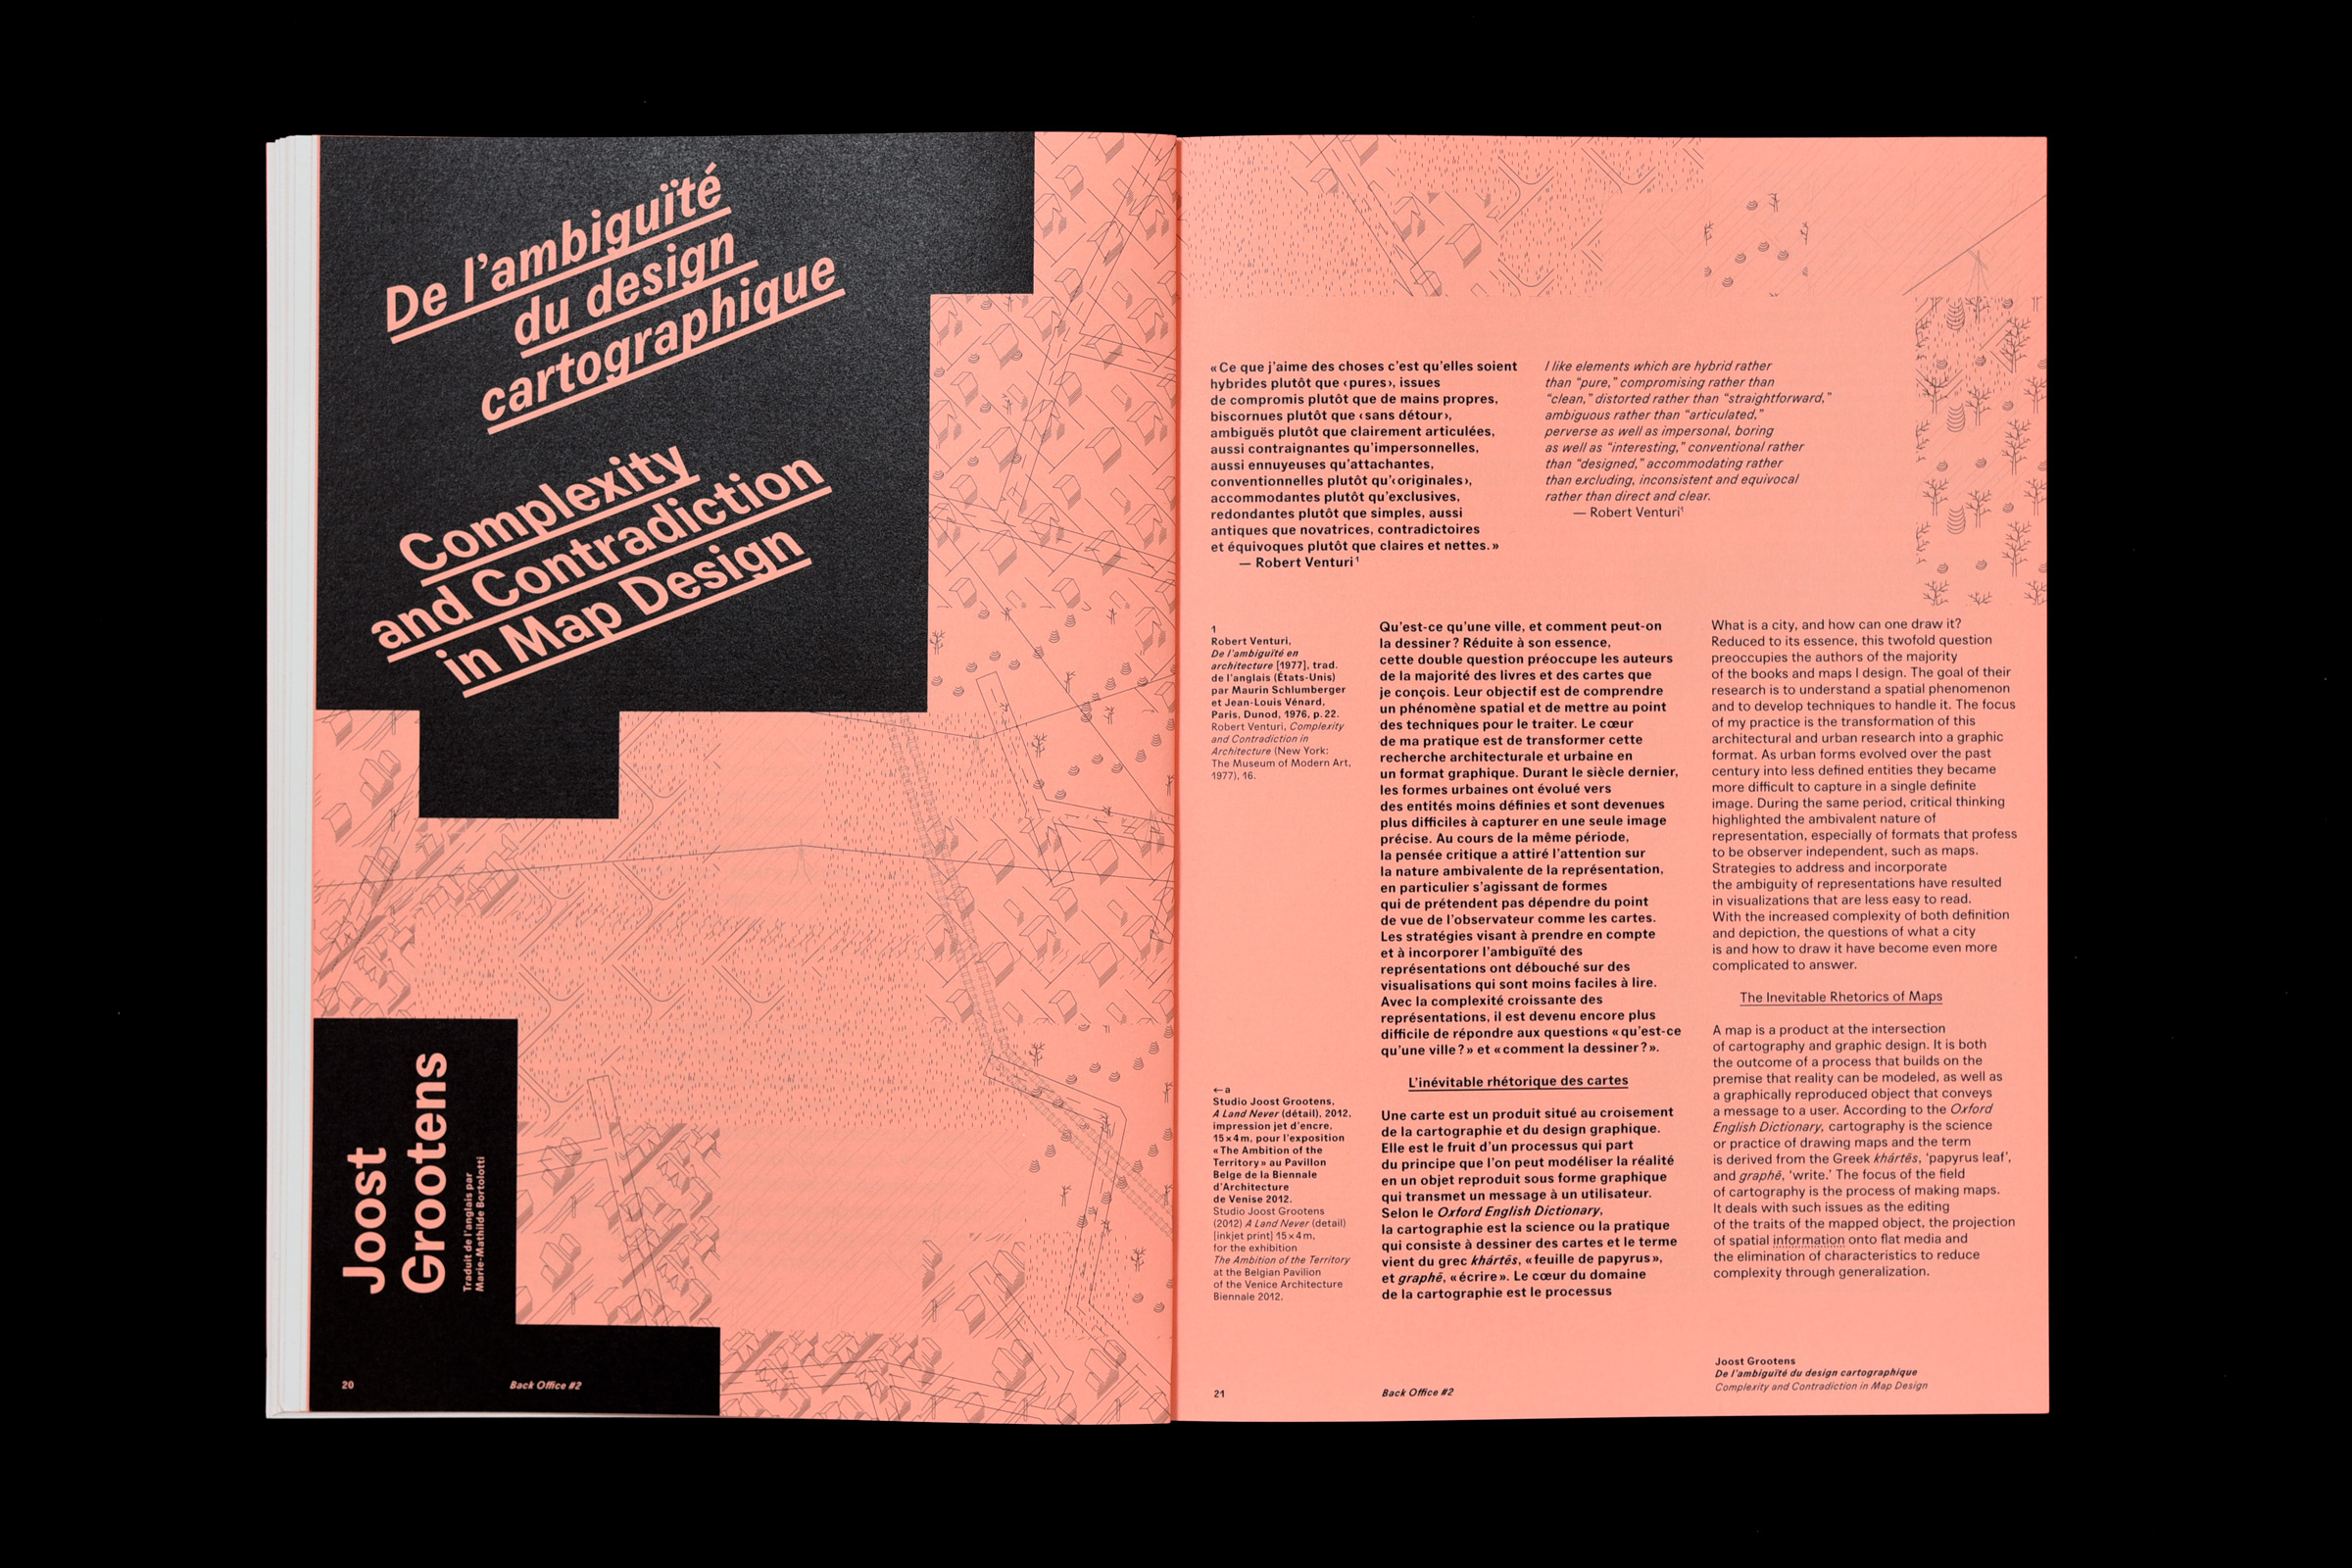
De l’ambigüité du design cartographique
par Joost Grootens
Qu’est-ce qu’une ville, et comment peut-on la dessiner ? Réduite à son essence, cette double question préoccupe les auteurs de la majorité des livres et des cartes que je conçois. Leur objectif est de comprendre un phénomène spatial et de mettre au point des techniques pour le traiter. Le cœur de ma pratique est de transformer cette recherche architecturale et urbaine en un format graphique. Avec la complexité croissante des représentations, il est devenu encore plus difficile de répondre aux questions « qu’est-ce qu’une ville ? » et « comment la dessiner ? ».
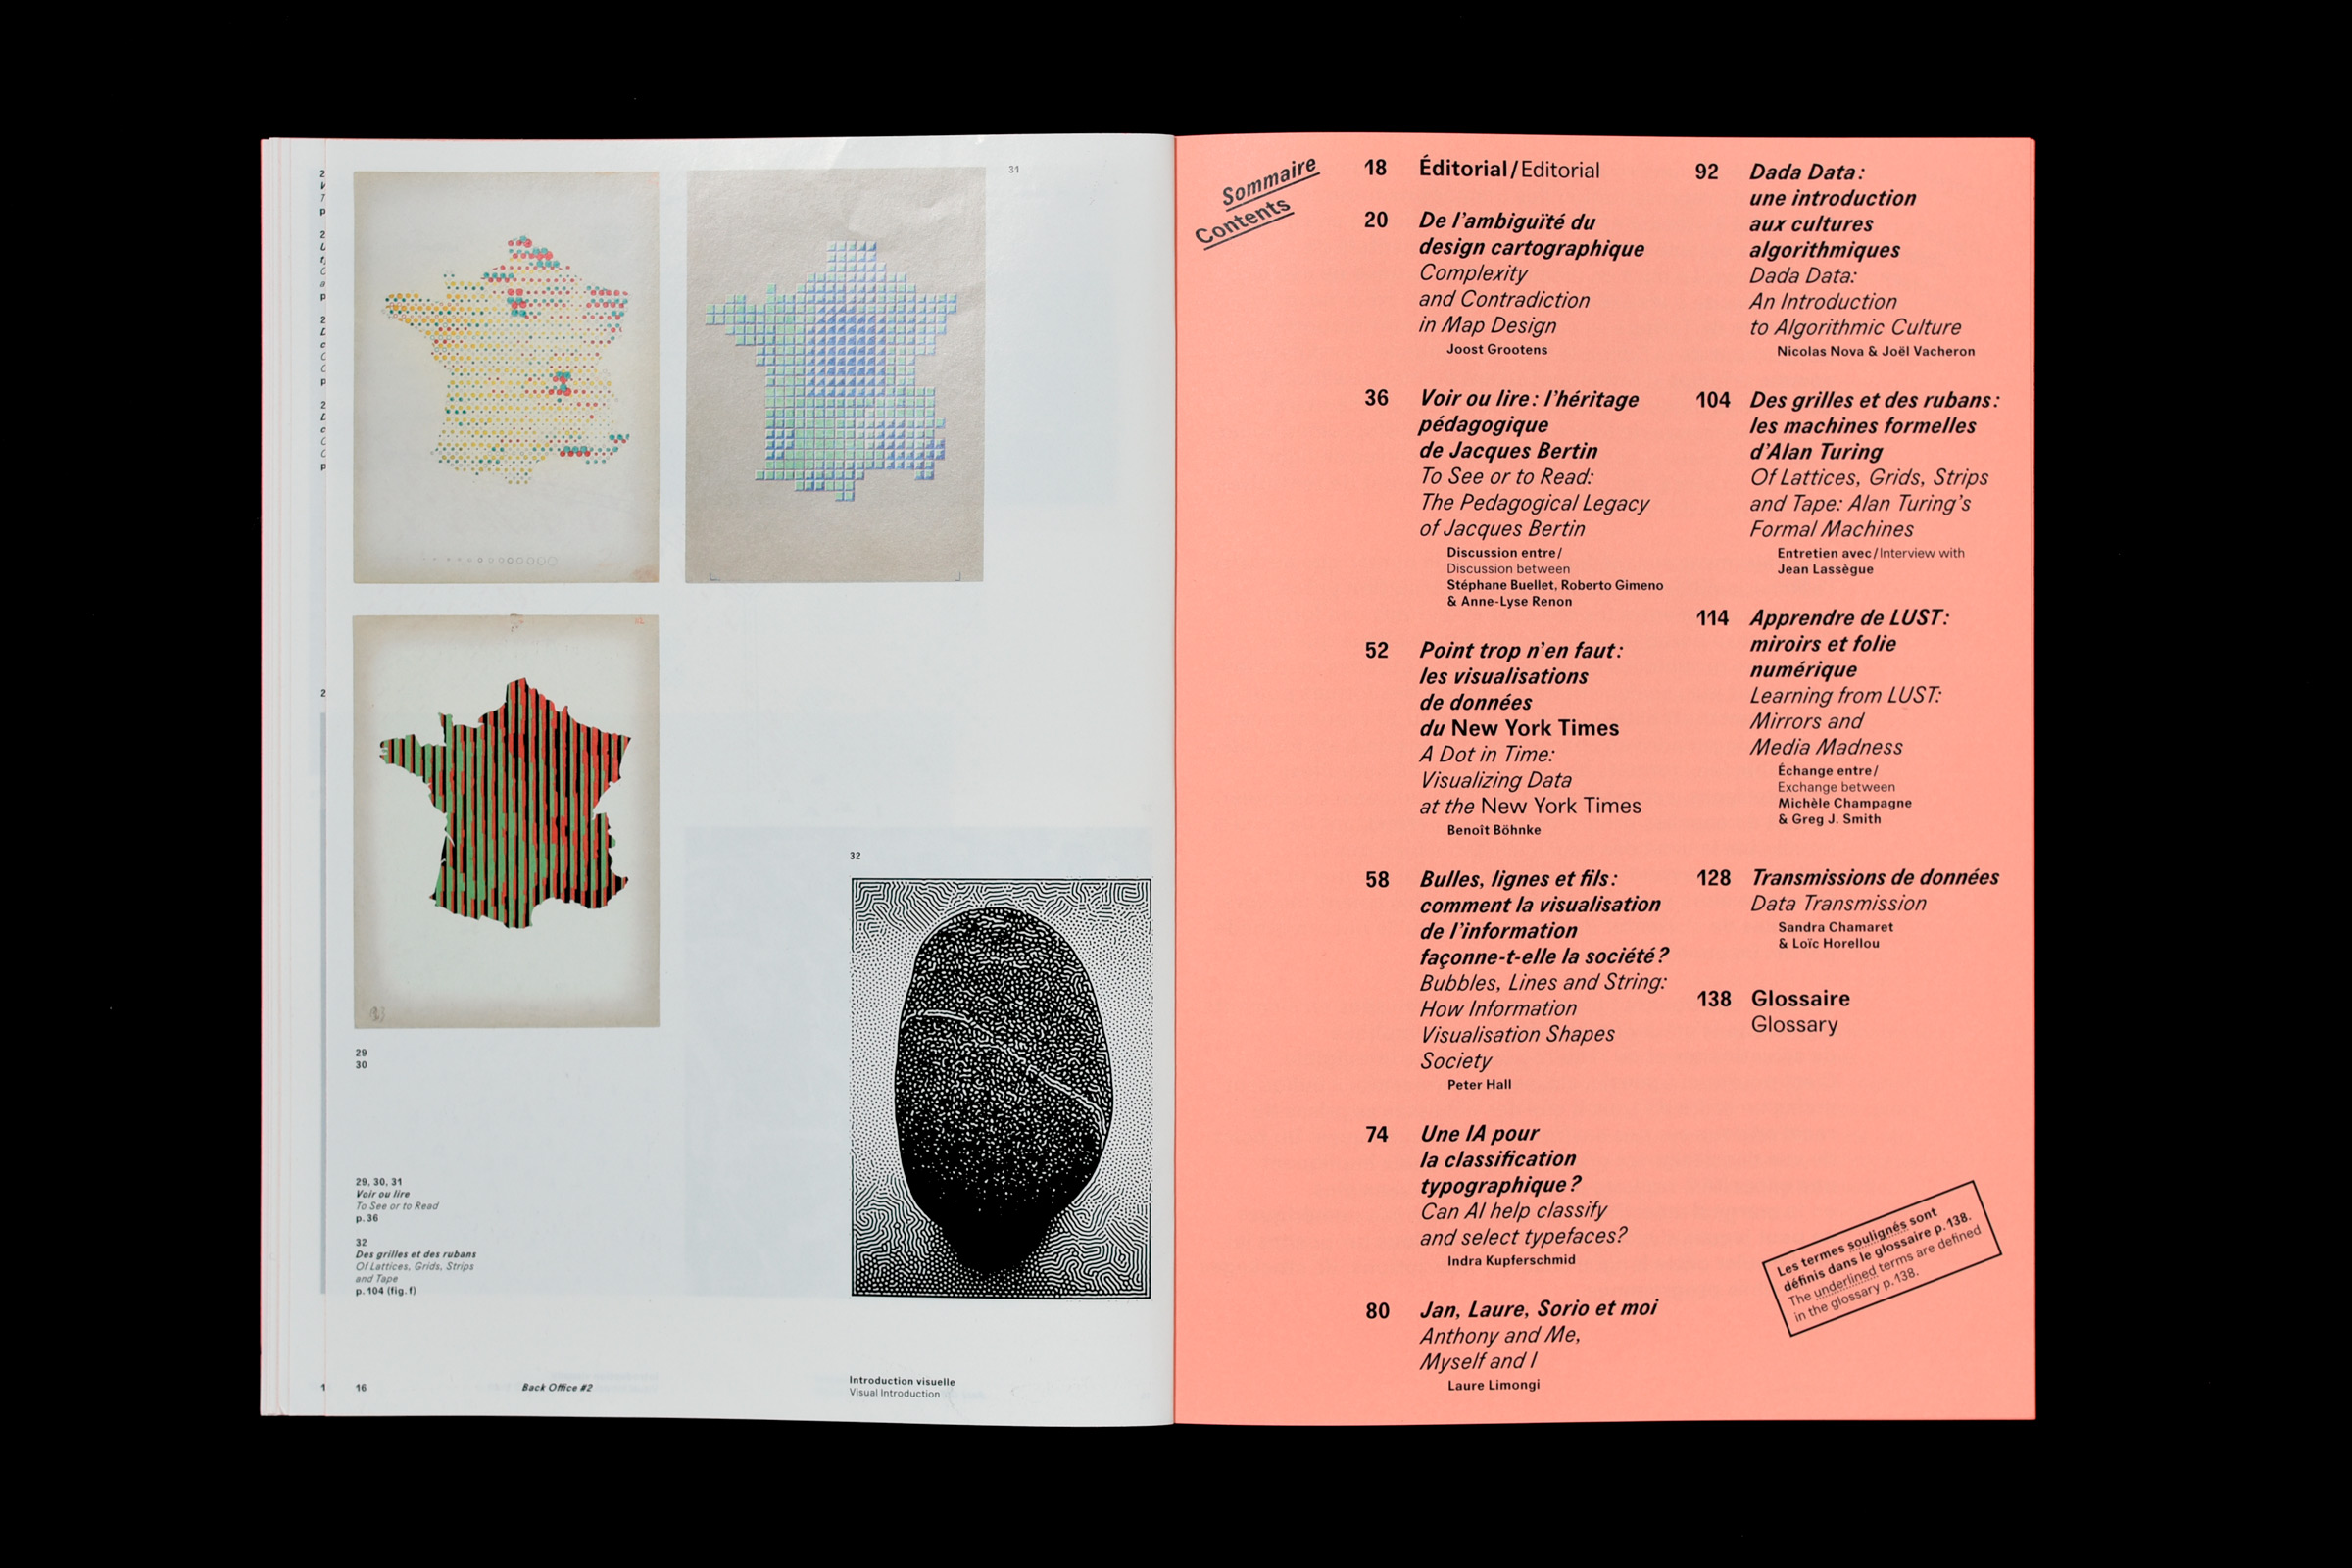
Voir ou lire : l’héritage pédagogique de Jacques Bertin
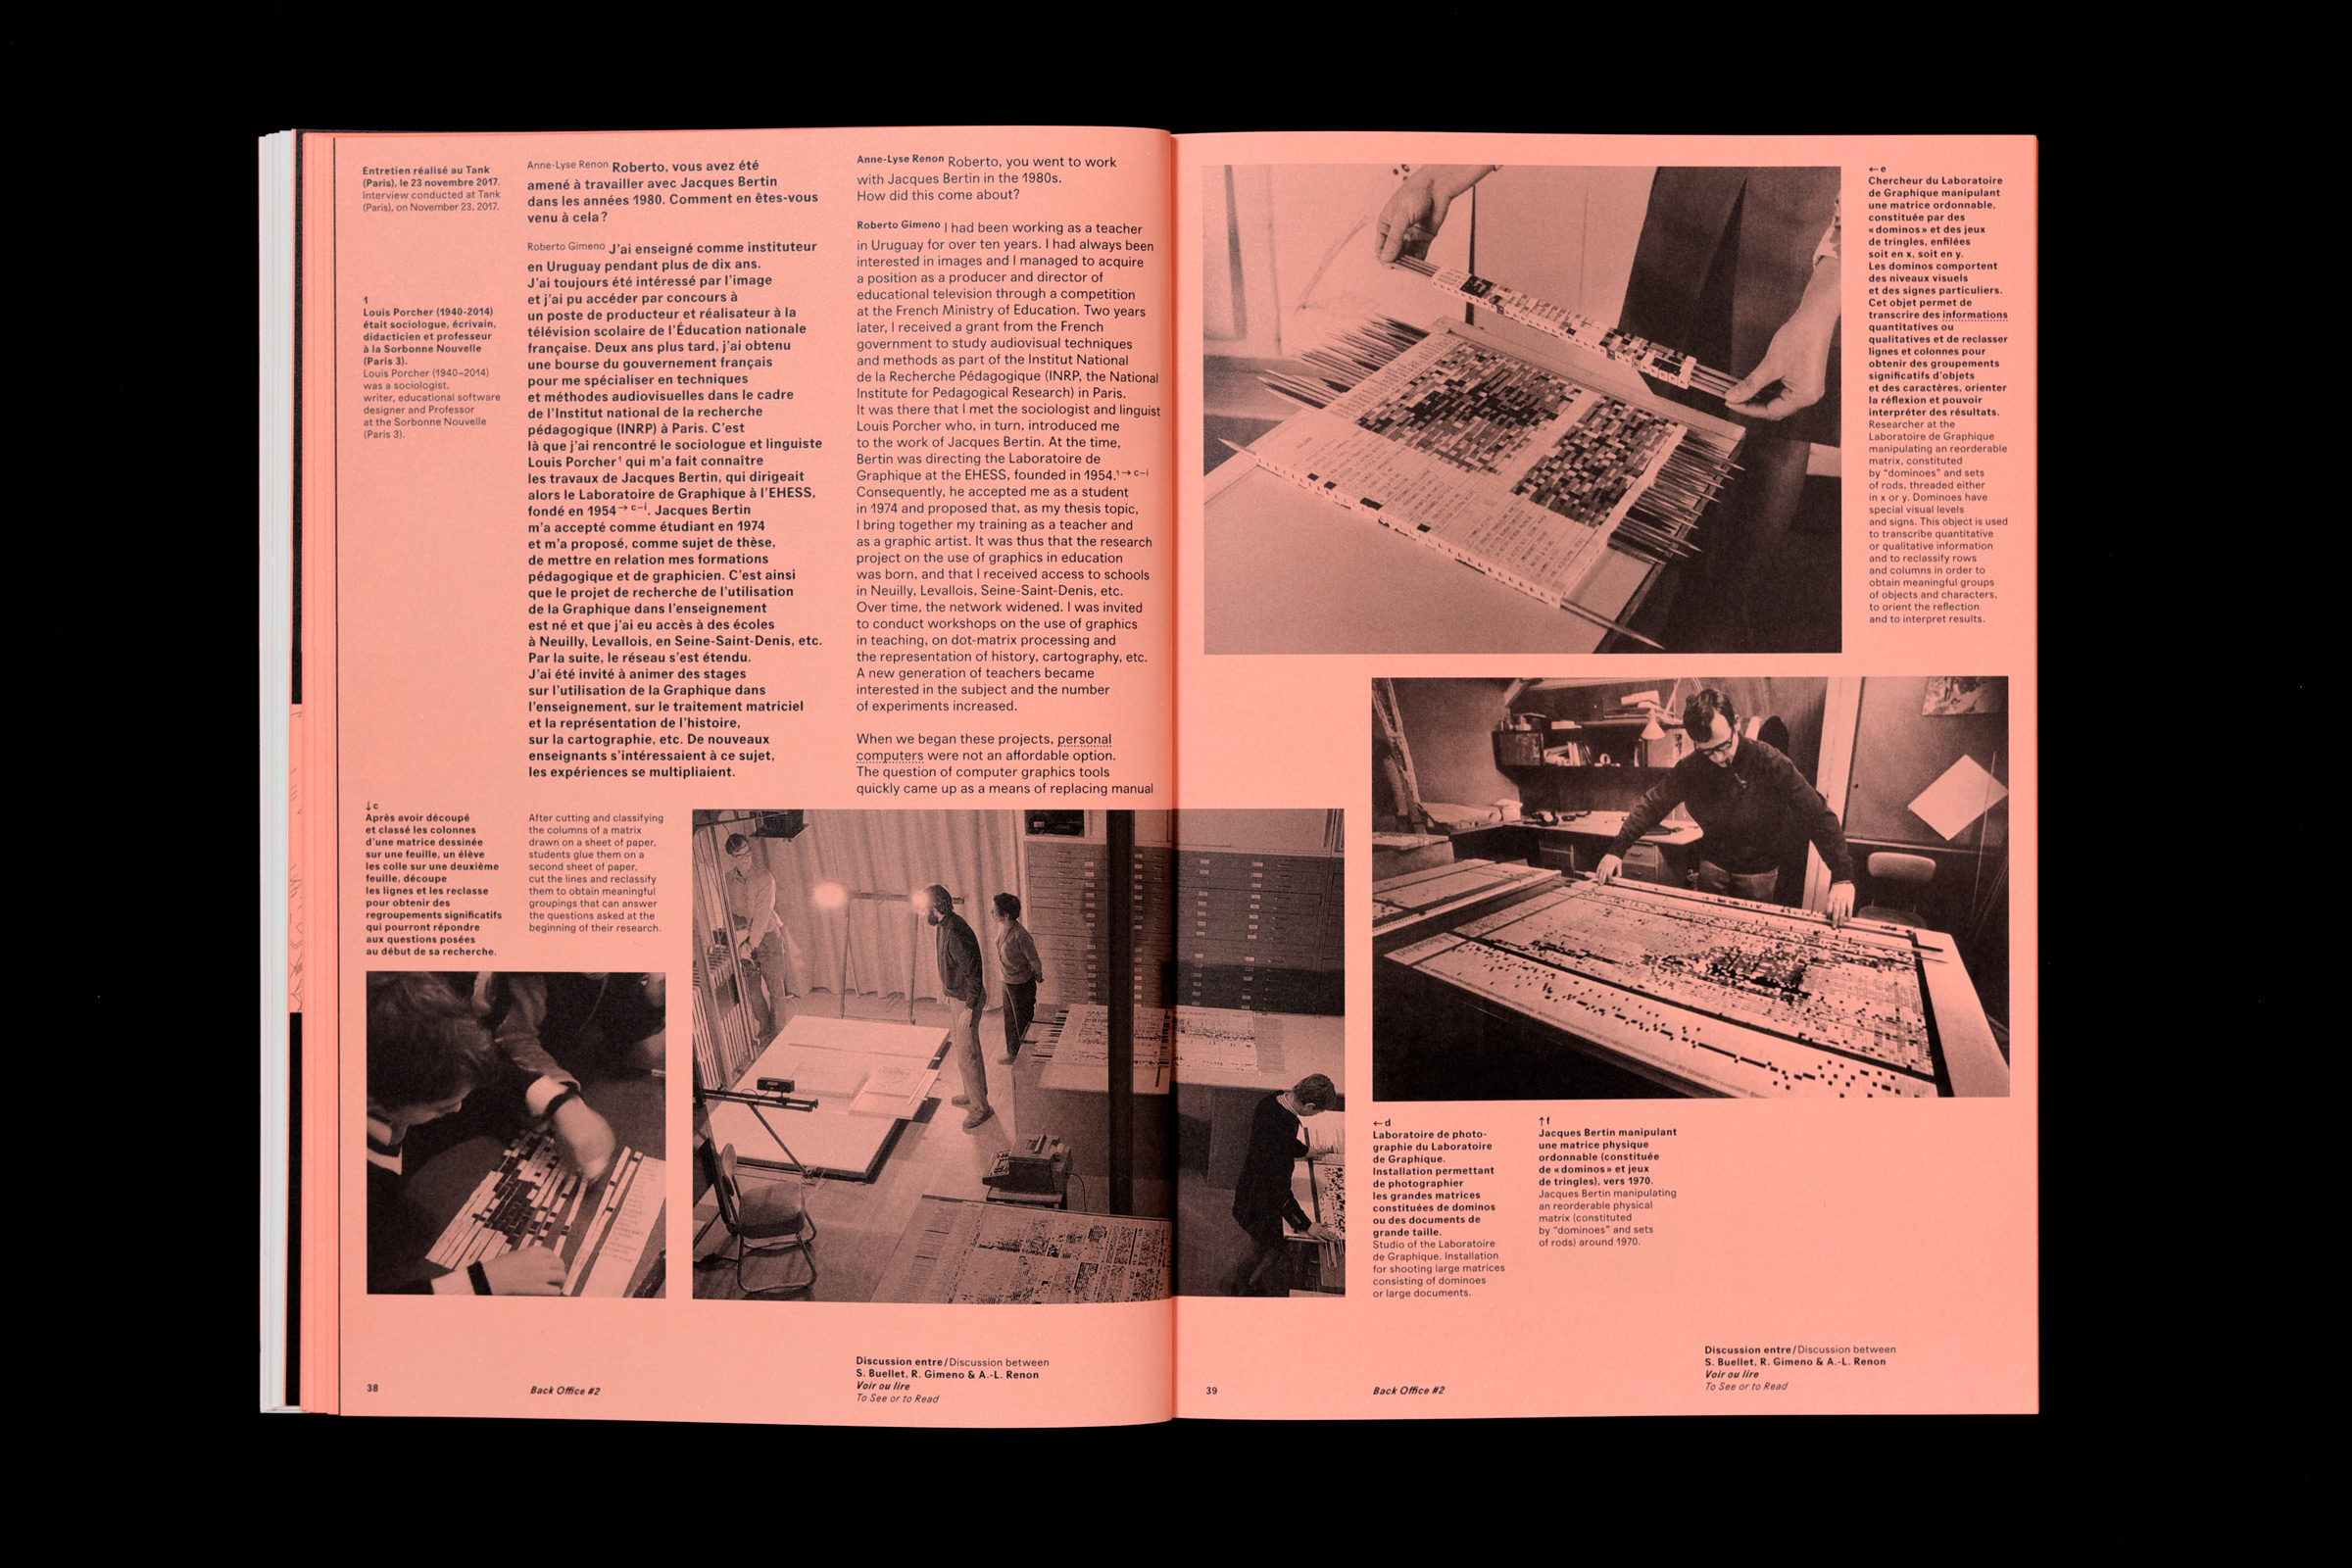
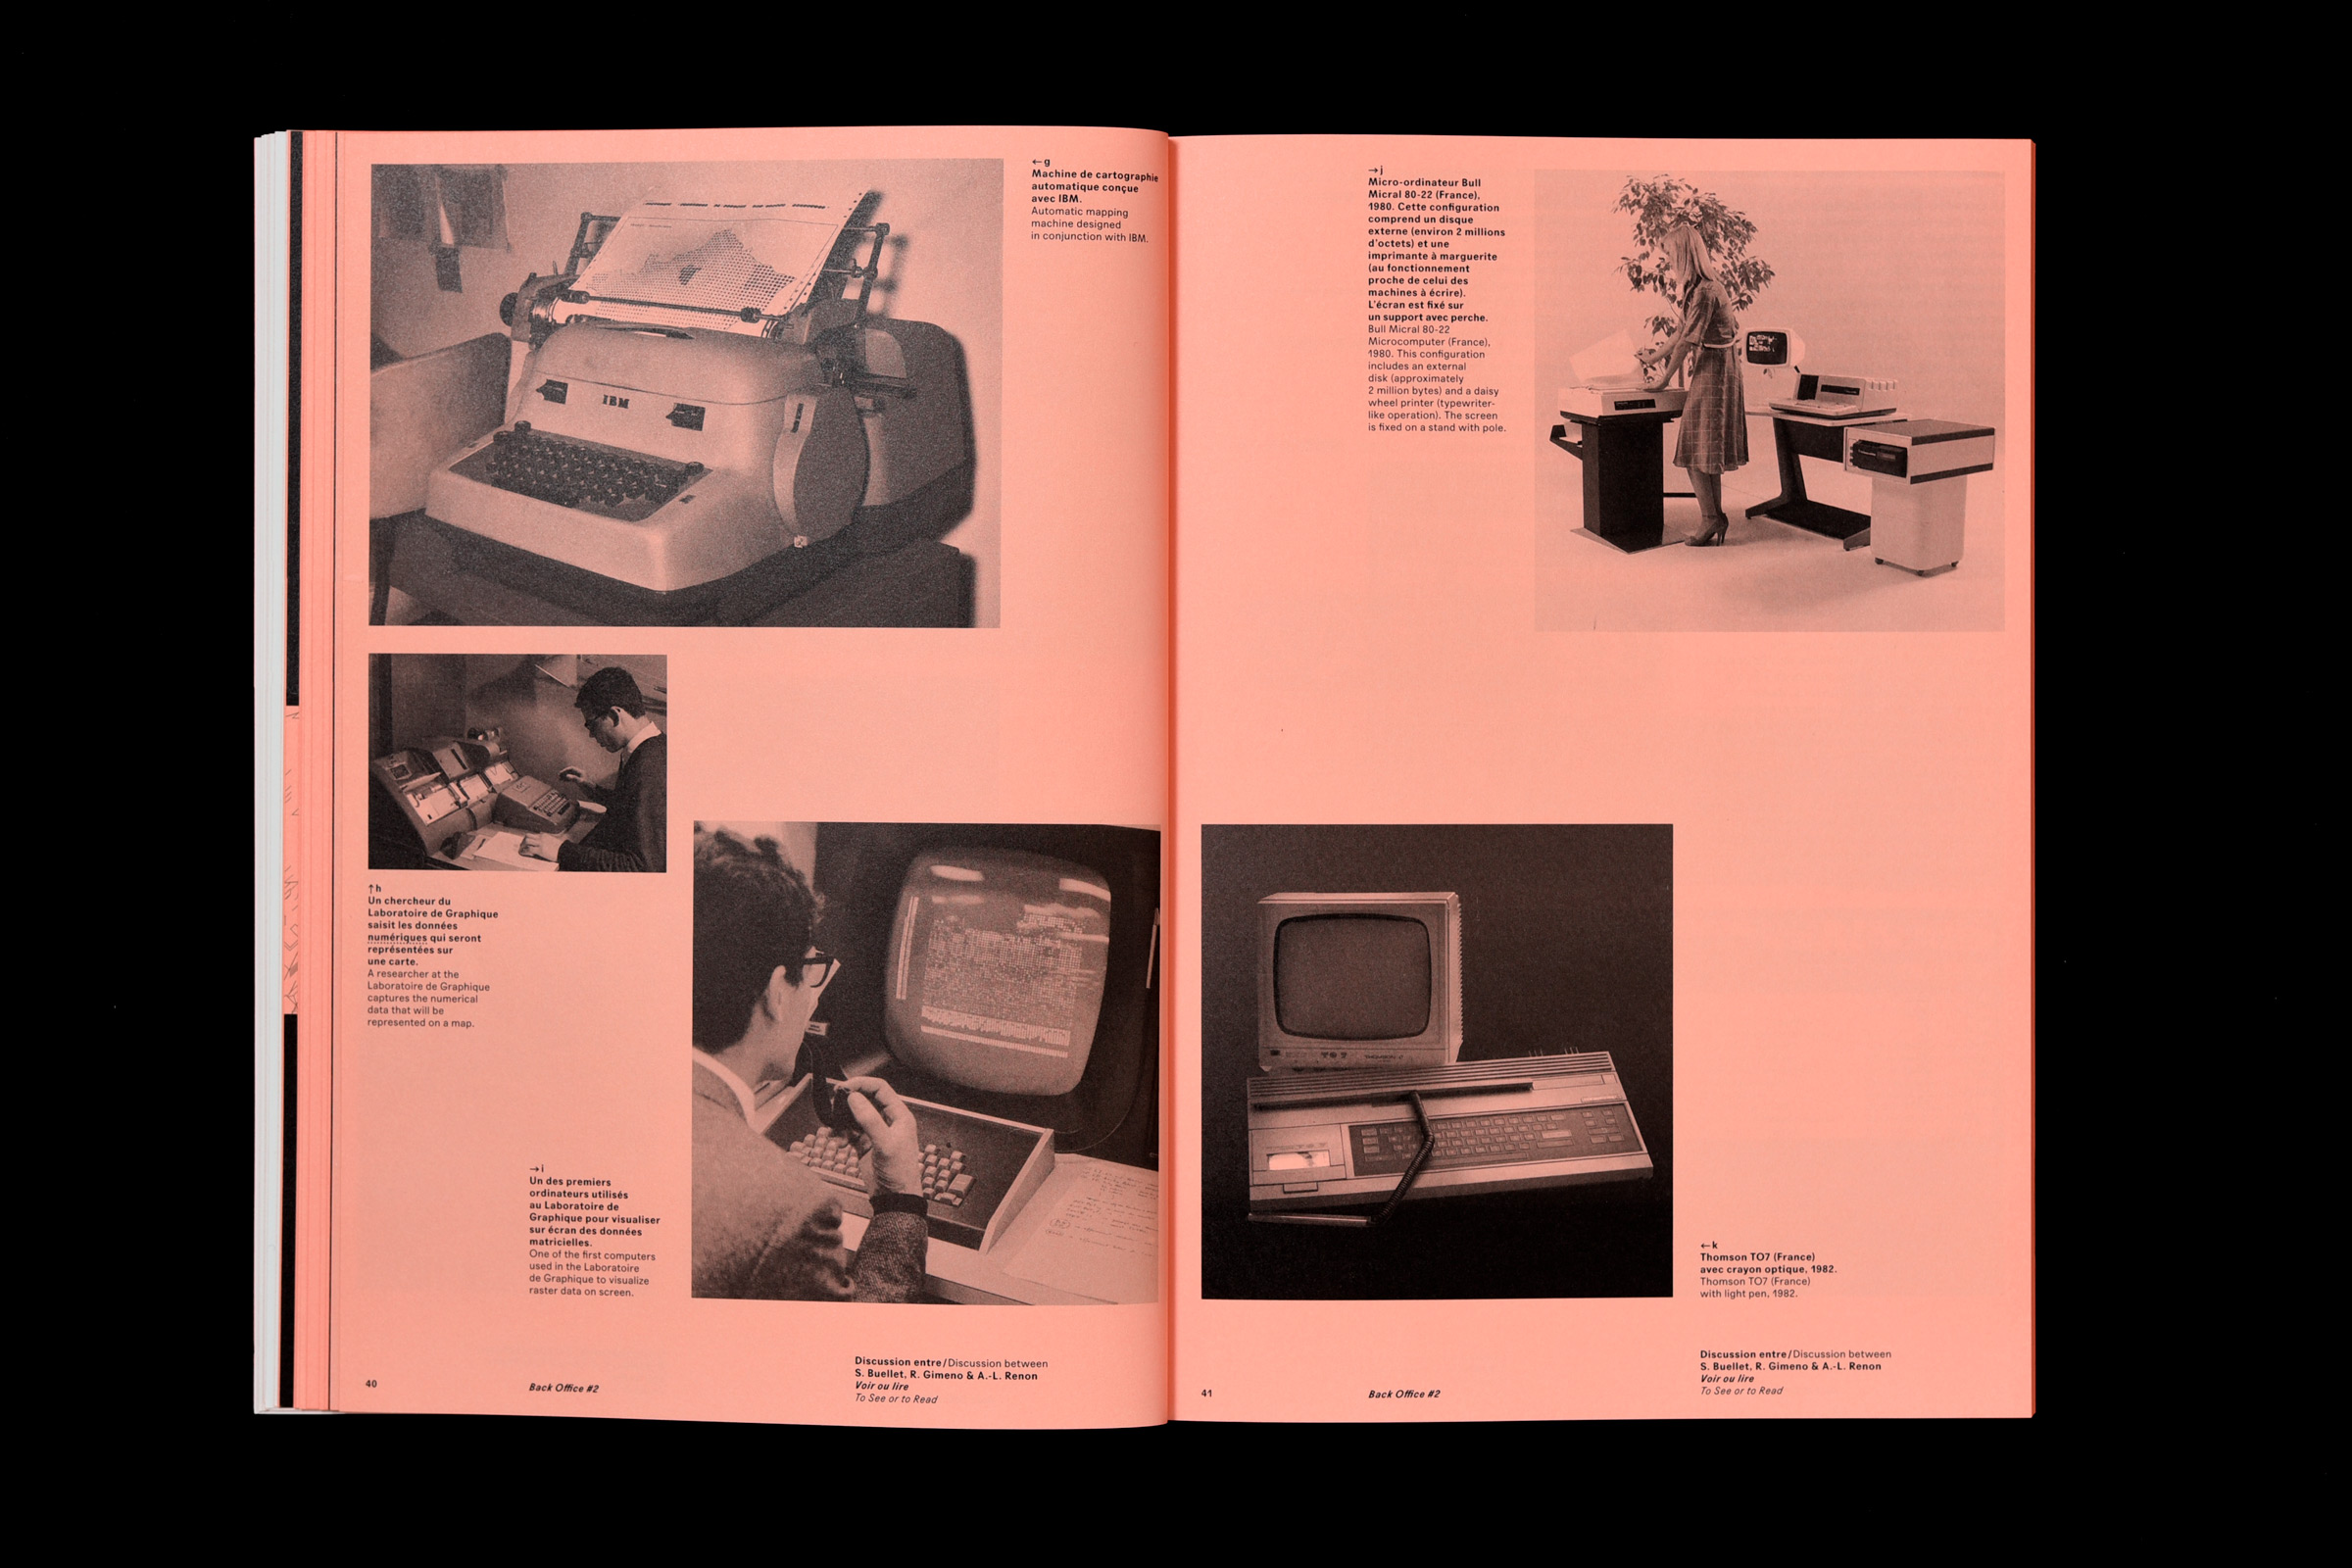
discussion entre Stéphane Buellet, Roberto Gimeno & Anne-Lyse Renon
Le Laboratoire de Cartographie, fondé par Jacques Bertin en 1954, devenu le Laboratoire de Graphique en 1974 (fermé en 2000), articulait de manière inédite production d’images scientifiques, représentation de données et recherches en sciences sociales. La chercheuse Anne-Lyse Renon et le designer graphique Stéphane Buellet se sont entretenus avec Roberto Gimeno pour mesurer, à plus de trente ans d’écart, l’héritage pédagogique du Laboratoire de Graphique.
Point trop n’en faut : les visualisations de données du New York Times
par Benoit Böhnke
Diagrammes, cartes, graphiques, nuages de points et schémas peuplent abondamment les pages Web et imprimées des grands journaux. Par une intrication de signes, de couleurs, de textes, de pictogrammes et d’images, ces visualisations s’emploient à offrir au lecteur une approche didactique de l’information. Depuis le début des années 2000 et le développement de la mise en réseau des données (big data, open data), la presse s’est elle aussi emparée de ces nouvelles représentations statistiques.
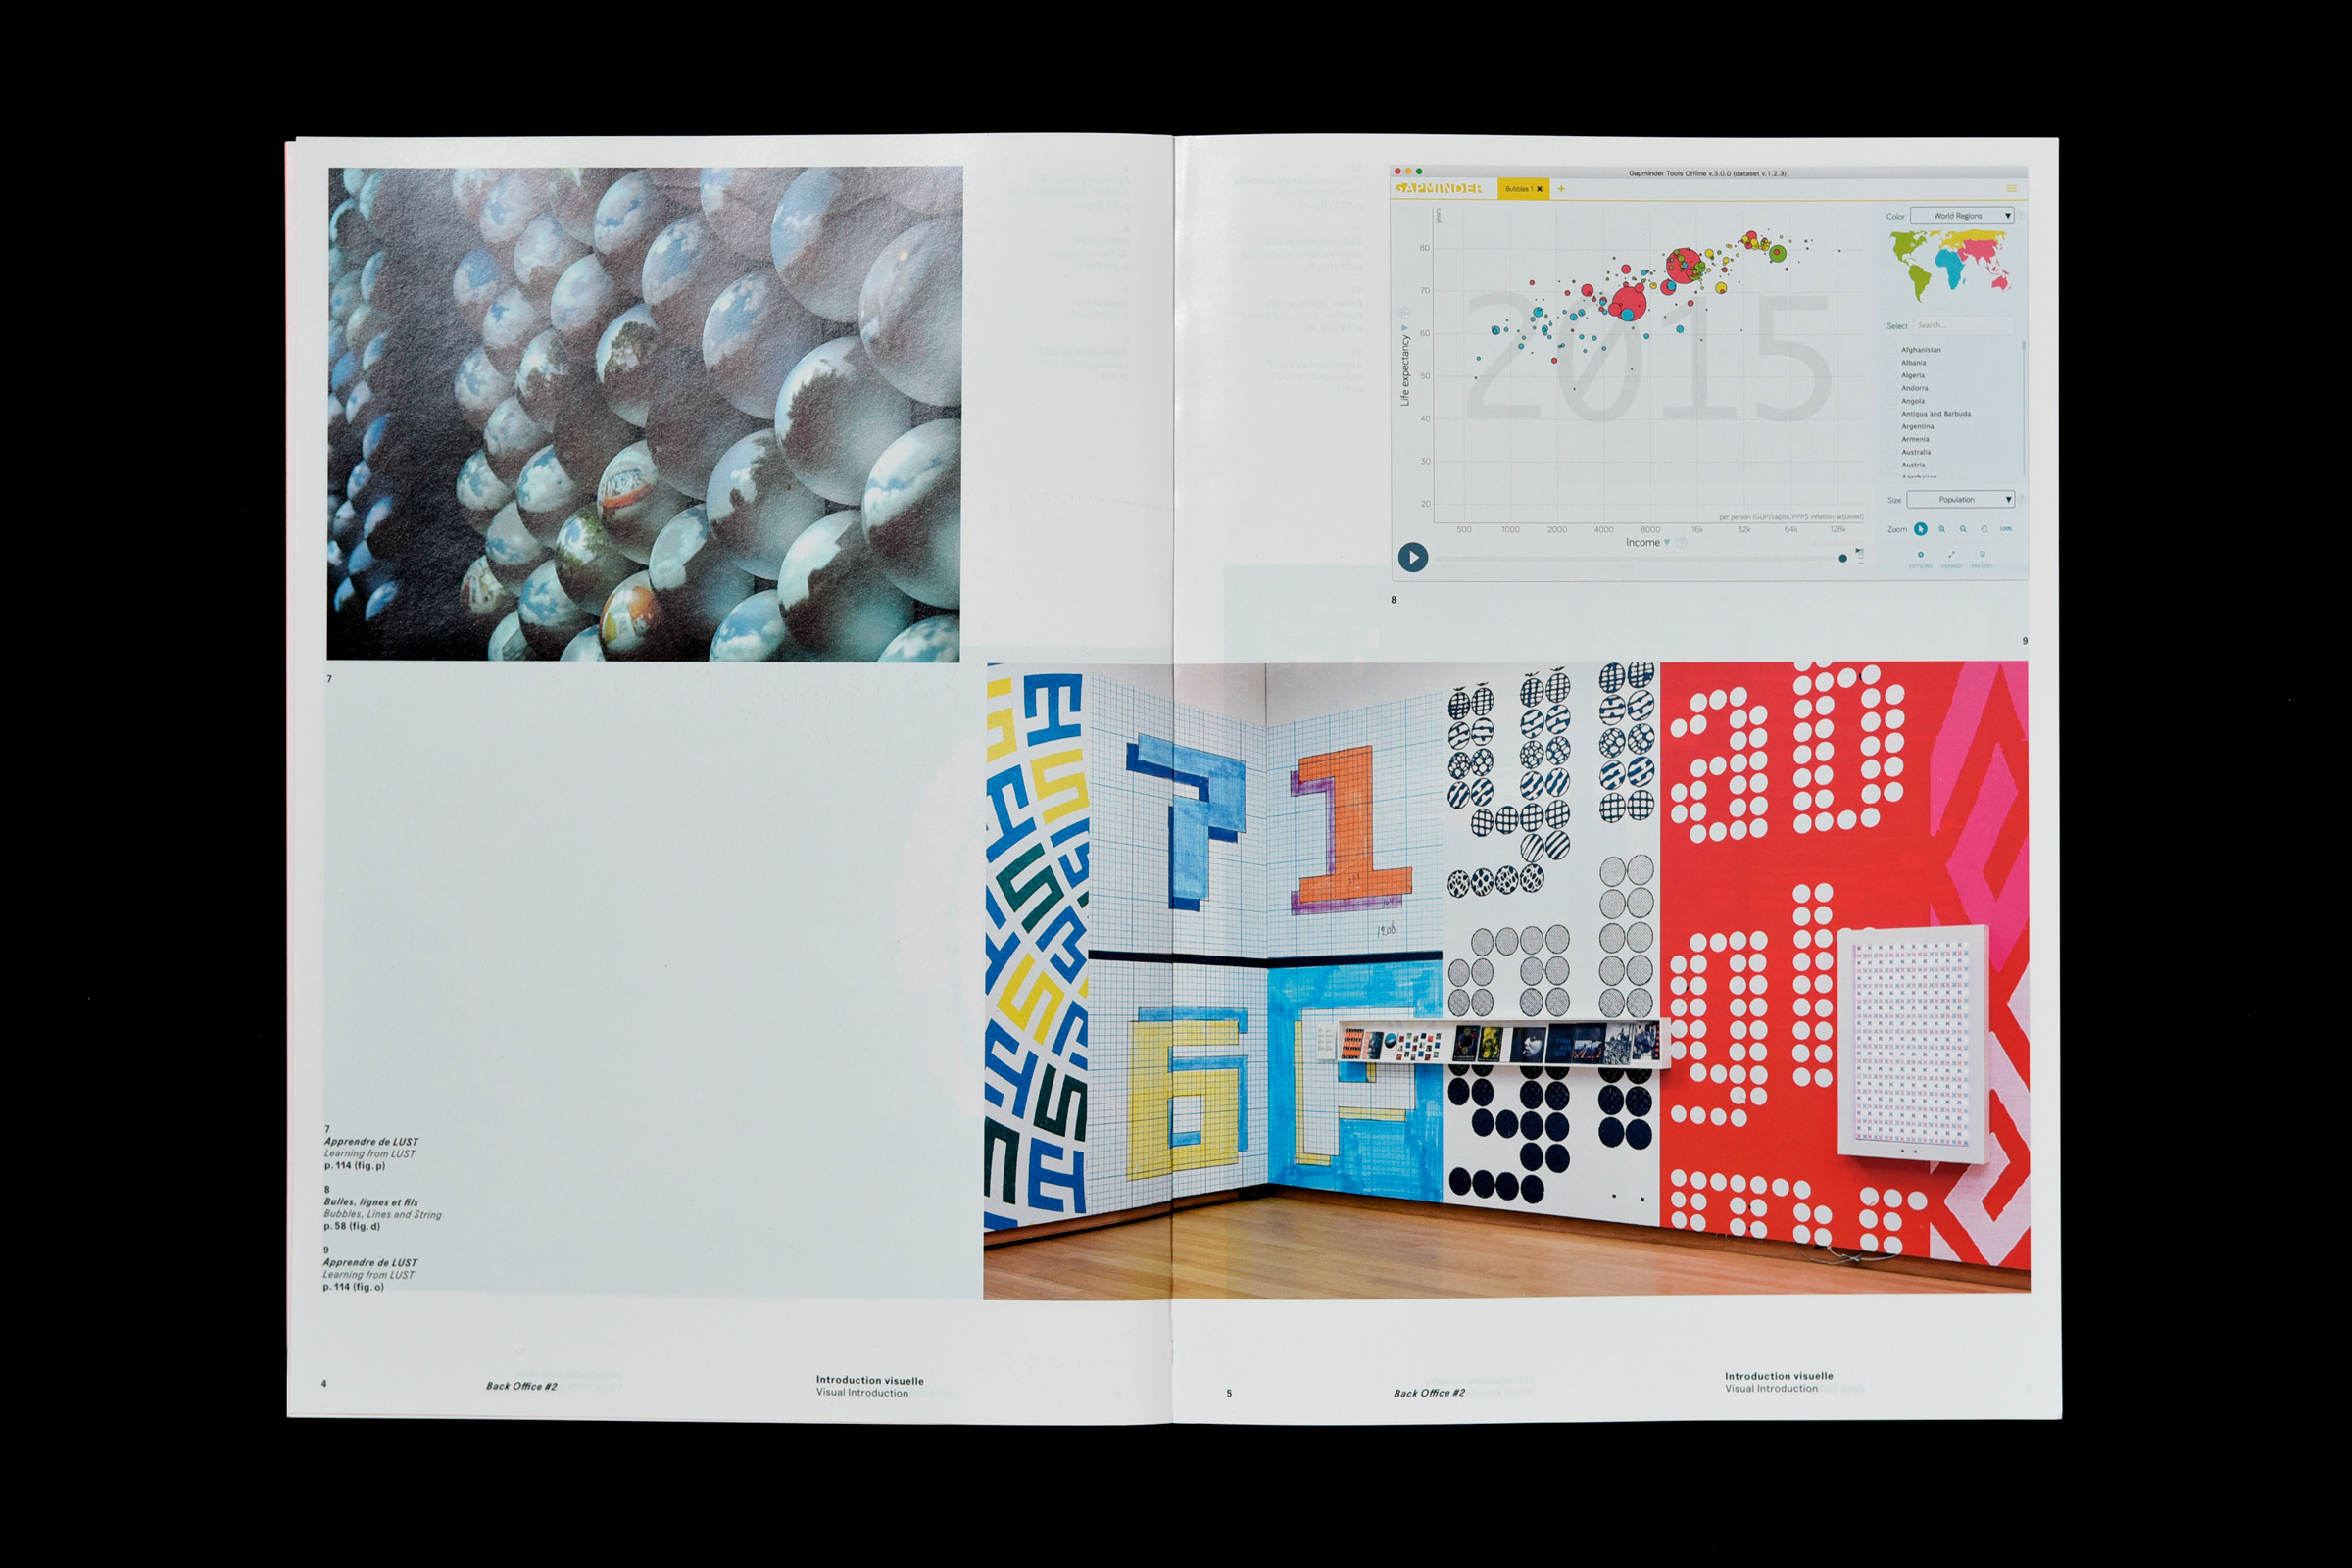
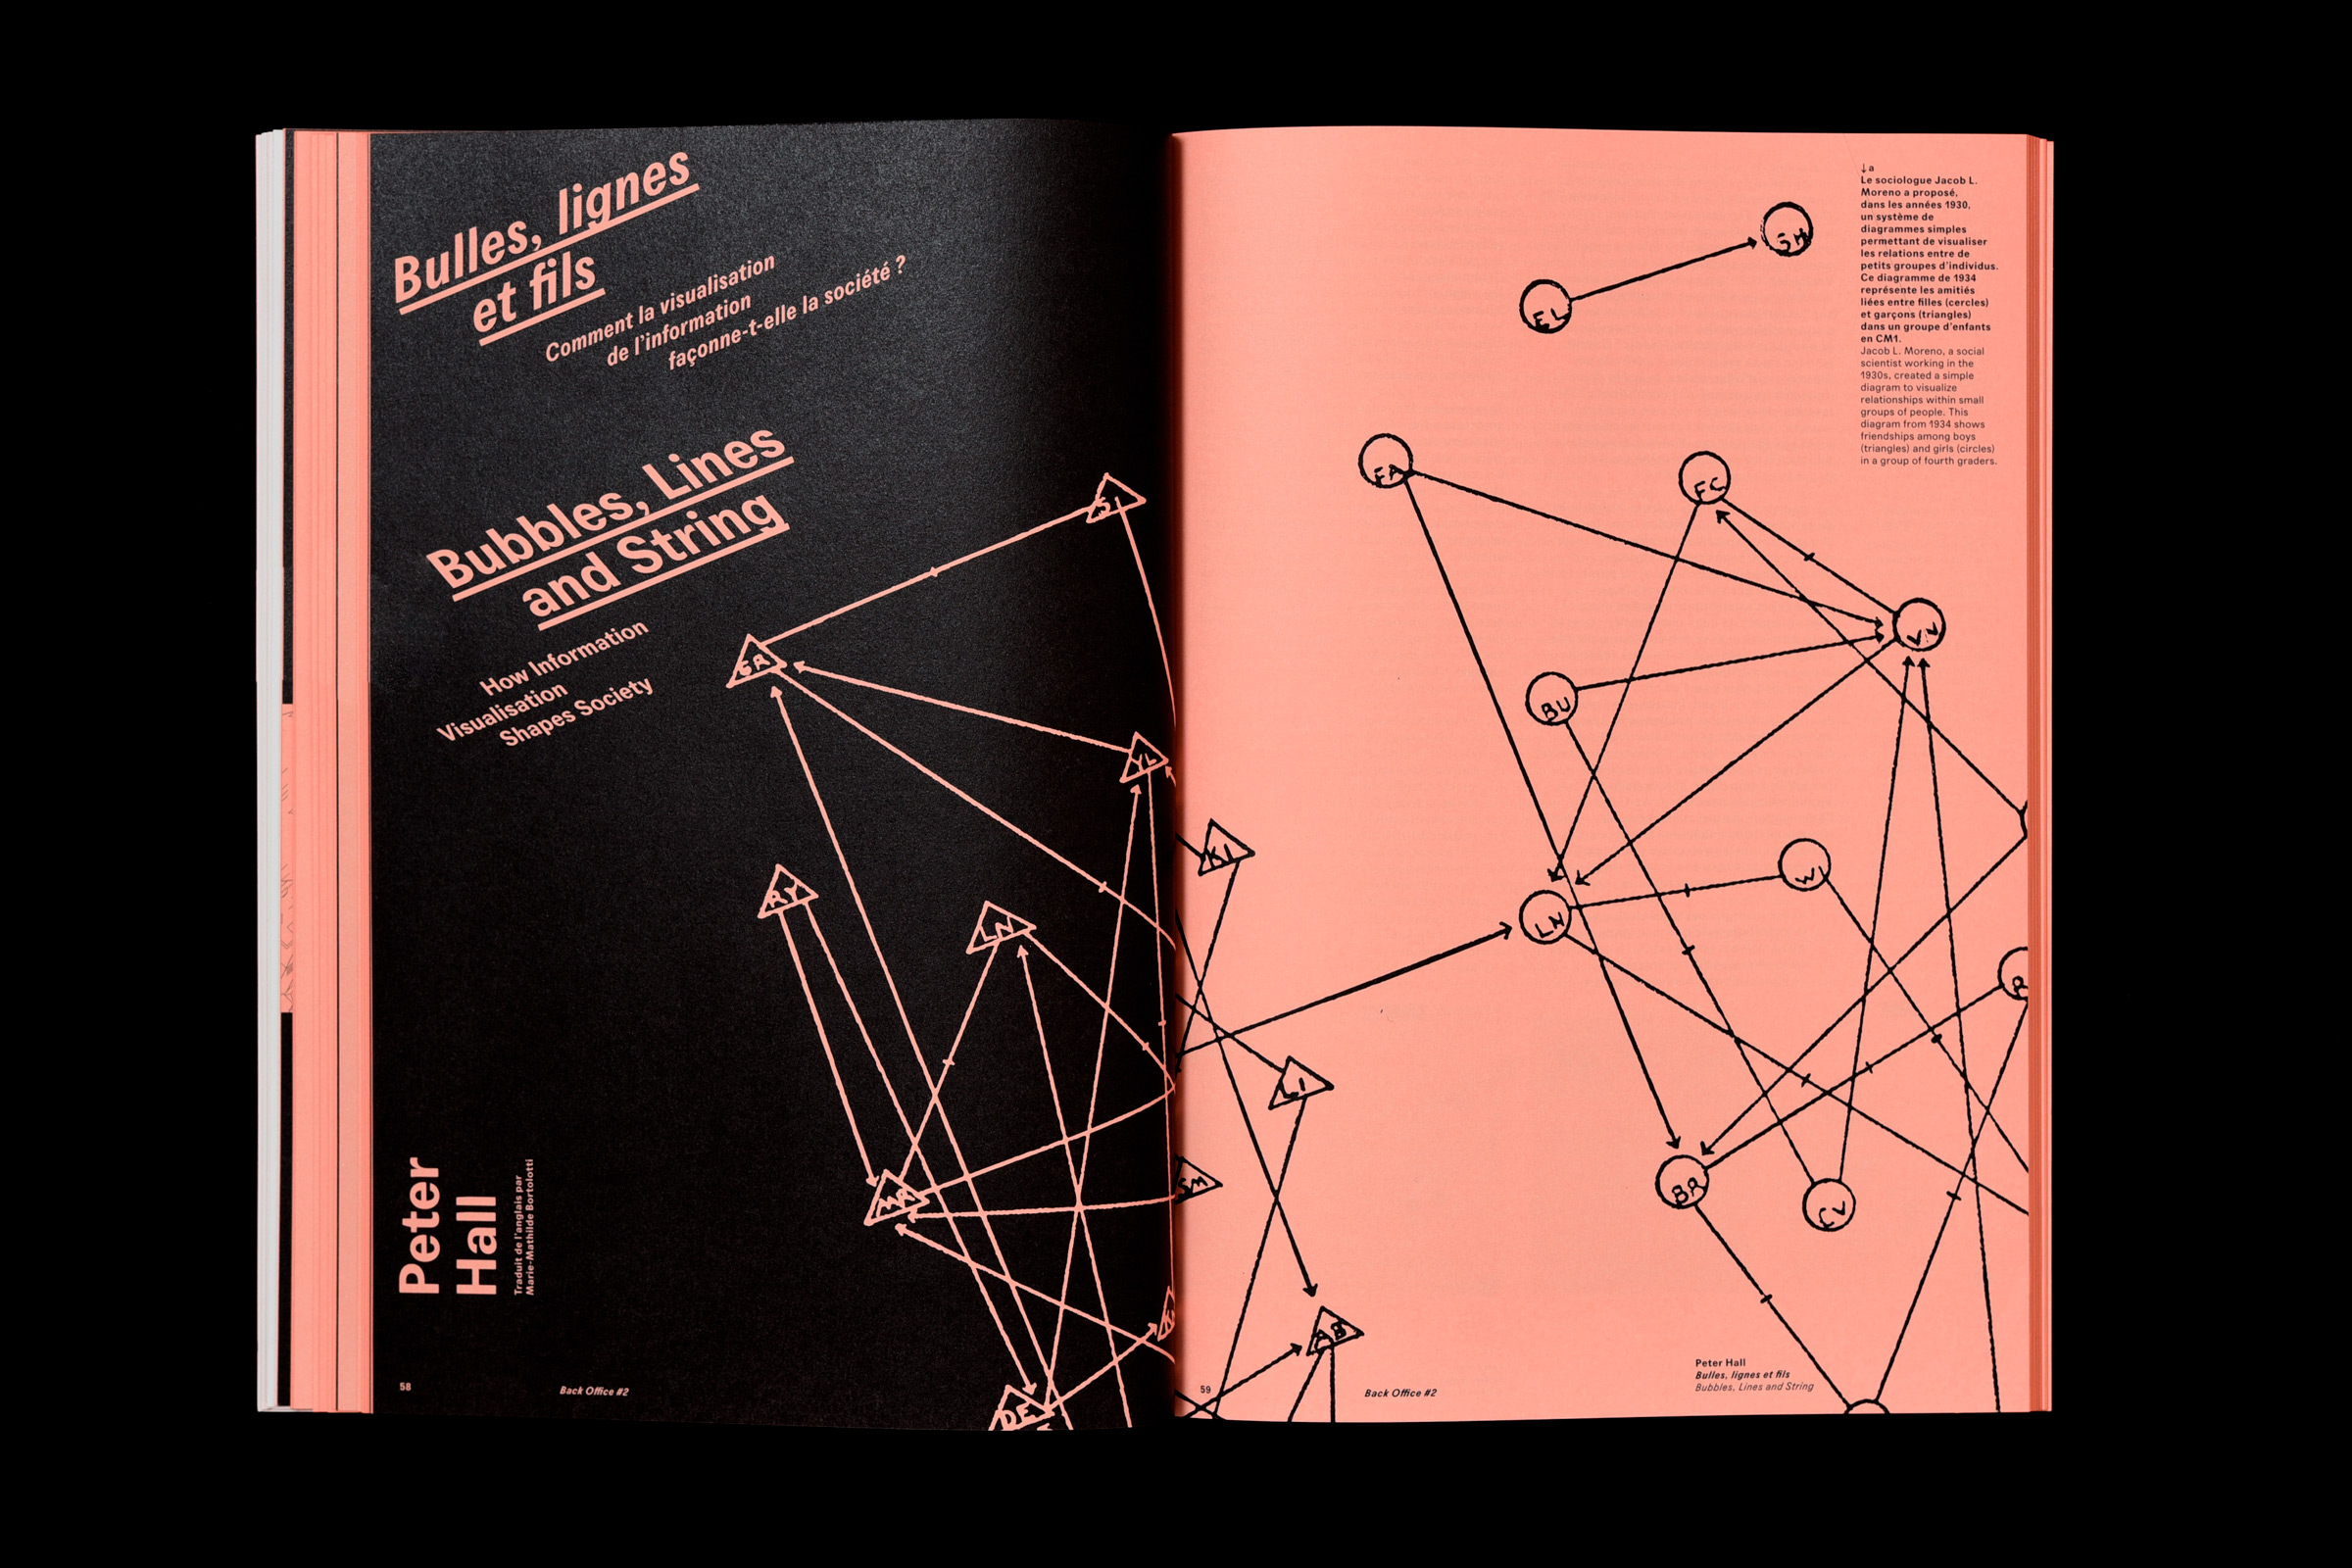
Bulles, lignes et fils : comment la visualisation de l’information façonne-t-elle la société ?
par Peter Hall
Les données offrent à la science les moyens de progresser, à la législation, ceux de changer et à la société, ceux de progresser ; elles sont les ennemies des chasses aux sorcières, du fanatisme et de l’ignorance (sans parler du créationnisme). Mais les données sont toujours rassemblées à un moment T et dans une intention précise ; pour être utiles, elles doivent être exploitées, analysées et présentées. Chaque étape de ce processus implique des décisions relatives à ce qui doit être laissé de côté et ce qui doit être mis en avant. Pourtant le résultat final, la visualisation, possède une autorité, une intemporalité et une objectivité qui font mentir ses origines. Curieusement, ce fait n’est pas pris en compte dans le discours, par ailleurs très riche, autour de la visualisation de données et du design de l’information.
Une IA pour la classification typographique ?
par Indra Kupferschmid
Lancé en 2017, le projet en ligne IDEO Font Map, ambitionne d’utiliser l’apprentissage automatisé et l’intelligence artificielle pour classer et regrouper la multitude des polices de caractères disponibles sur le répertoire Google Fonts. En quoi ces nouvelles méthodes permettent-elles, ou non, d’actualiser les systèmes de classification typographiques ?
Jan, Laure, Sorio et moi
par Laure Limongi
Carte blanche à l’écrivaine Laure Limongi pour une fiction autour de la thématique du numéro.
Dada Data : une introduction aux cultures algorithmiques
par Nicolas Nova & Joël Vacheron
À travers des exemples littéraires comme le Manifeste Dada, cet article cherche à montrer la place croissante occupée par les fonctionnalités logicielles dans la diffusion et la production de contenus culturels inédits. En d’autres termes, nous assistons à l’avènement d’une « culture algorithmique » qui reflète l’influence croissante du numérique et des programmes informatiques dans la production et la diffusion de produits culturels.
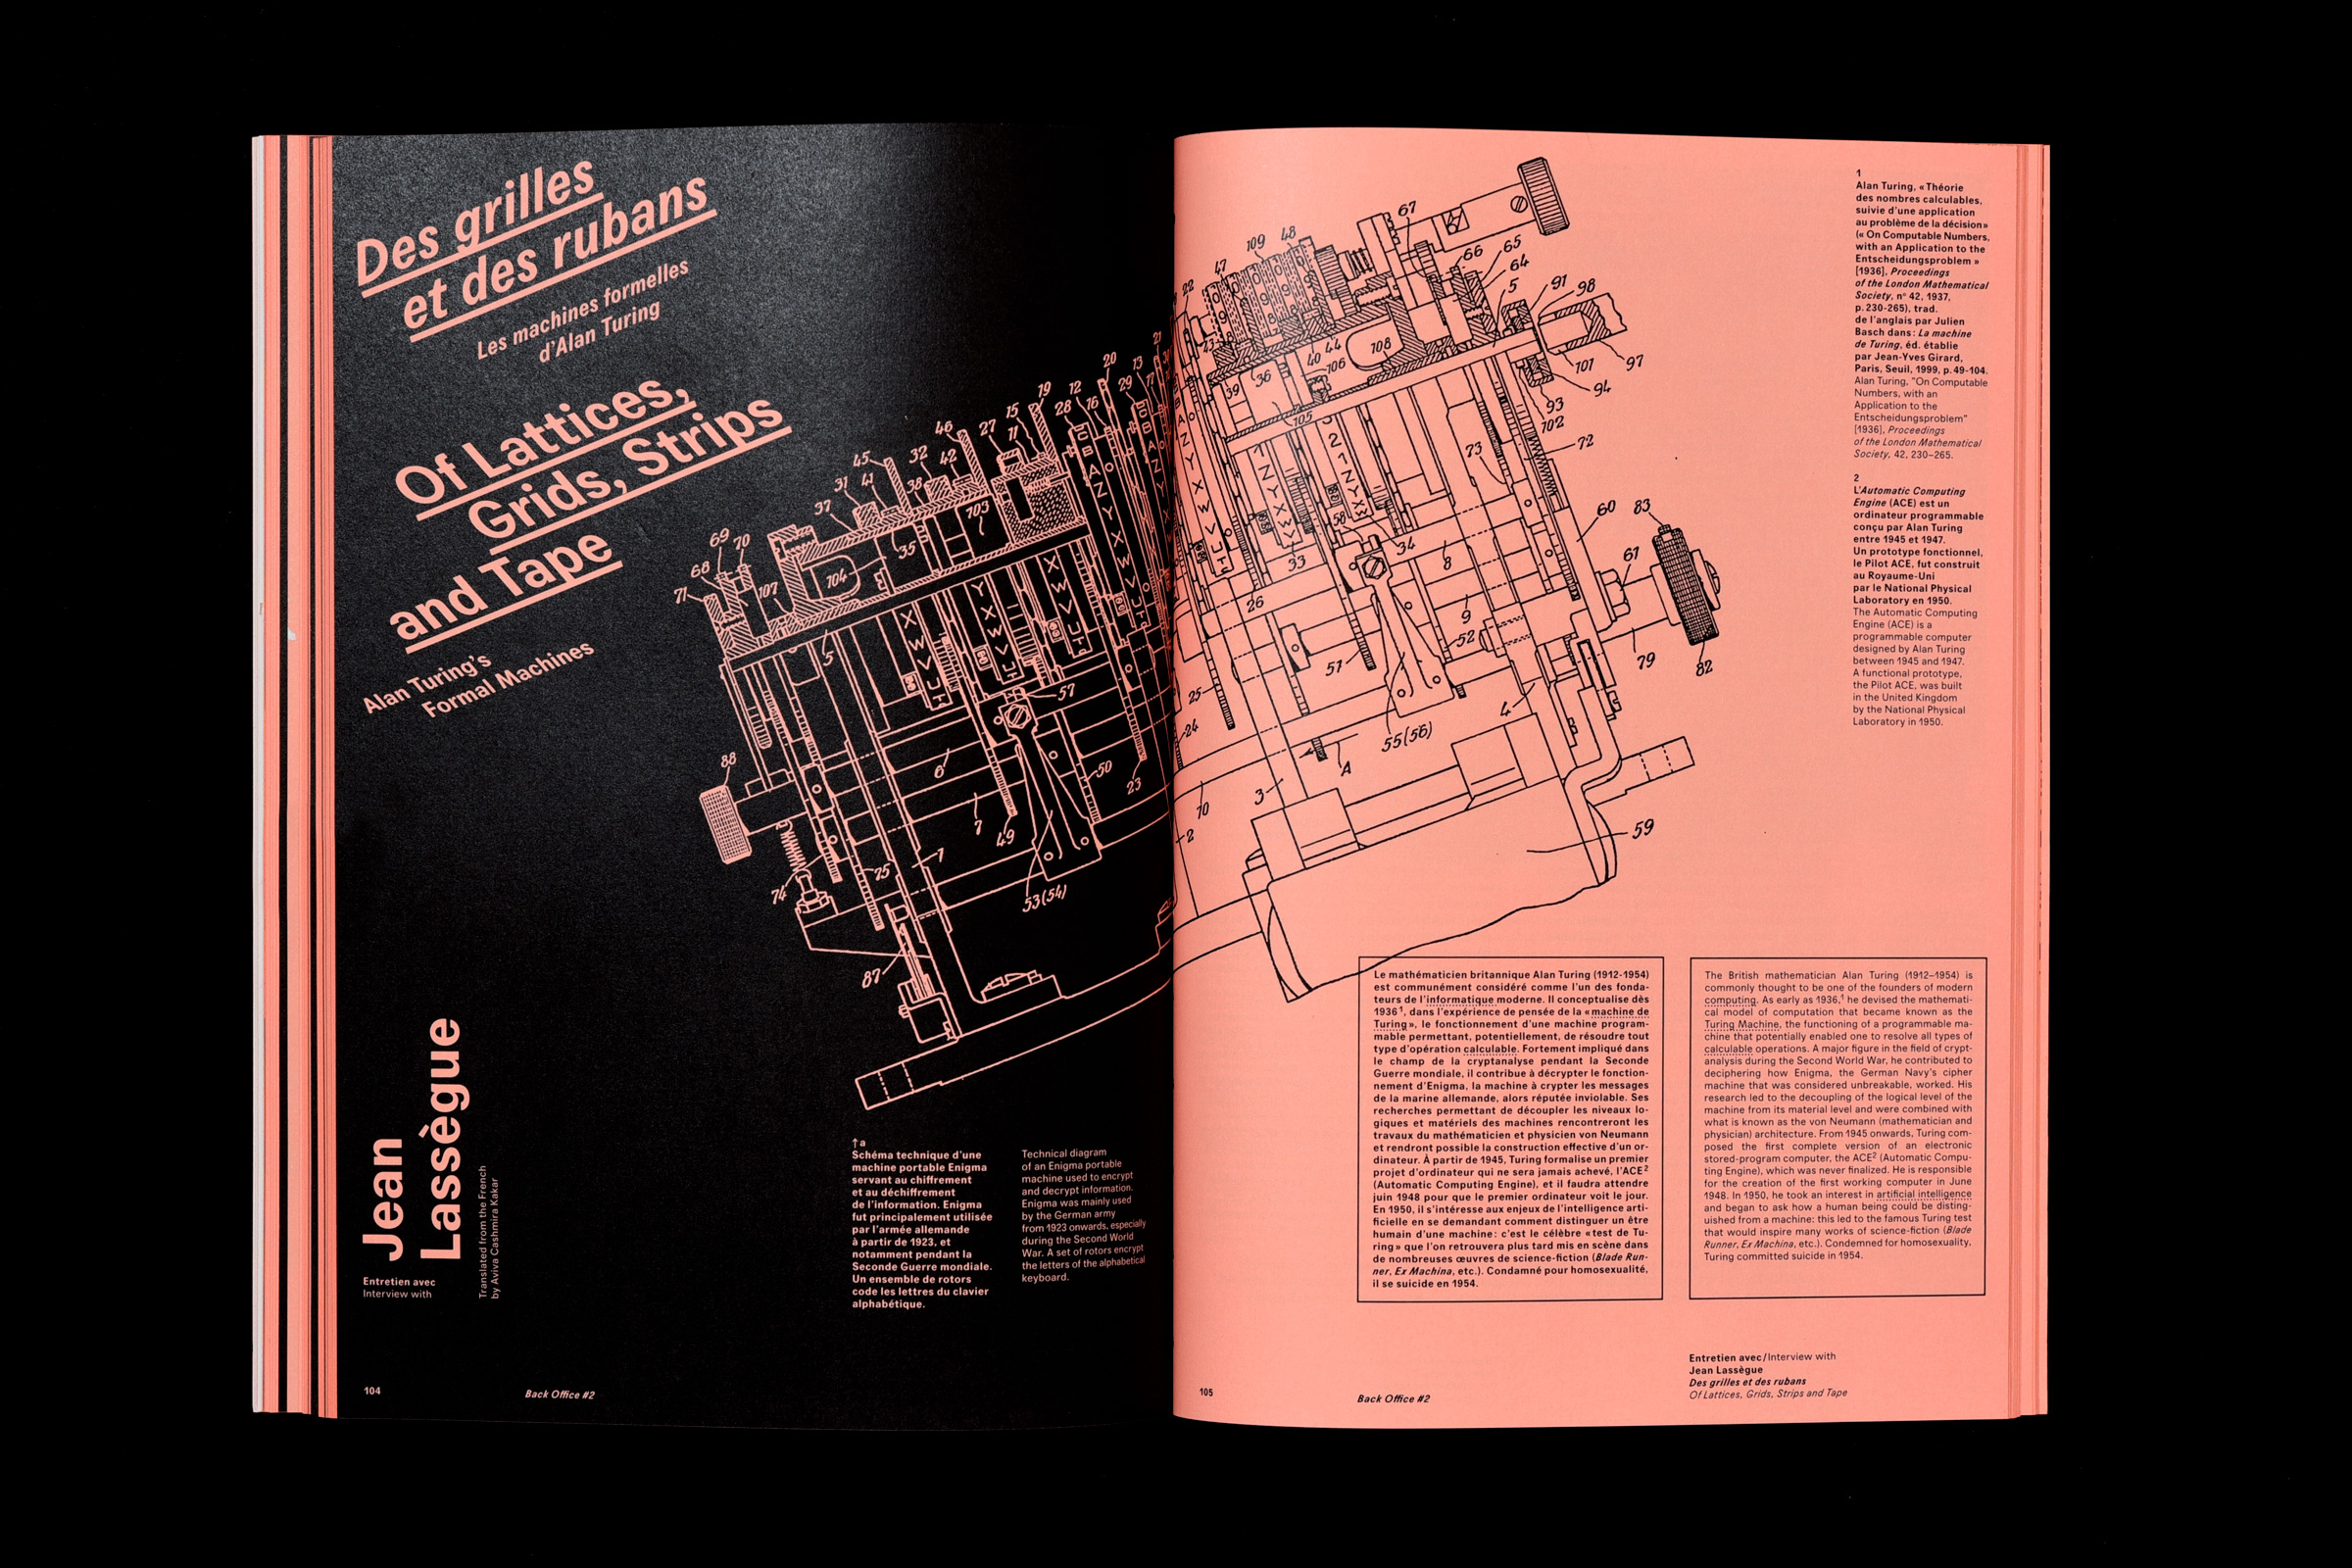
Des grilles et des rubans : les machines formelles d’Alan Turing
entretien avec Jean Lassègue
Quels sont les liens entre information et informatique ? Comment et pourquoi l’informatique a-t-elle été inventée ? Les ordinateurs sont-ils capables de représenter des données et de créer des formes ? Pour en savoir plus, l’équipe de Back Office s’est entretenue avec Jean Lassègue, philosophe et épistémologue, auteur d’une biographie d’Alan Turing.
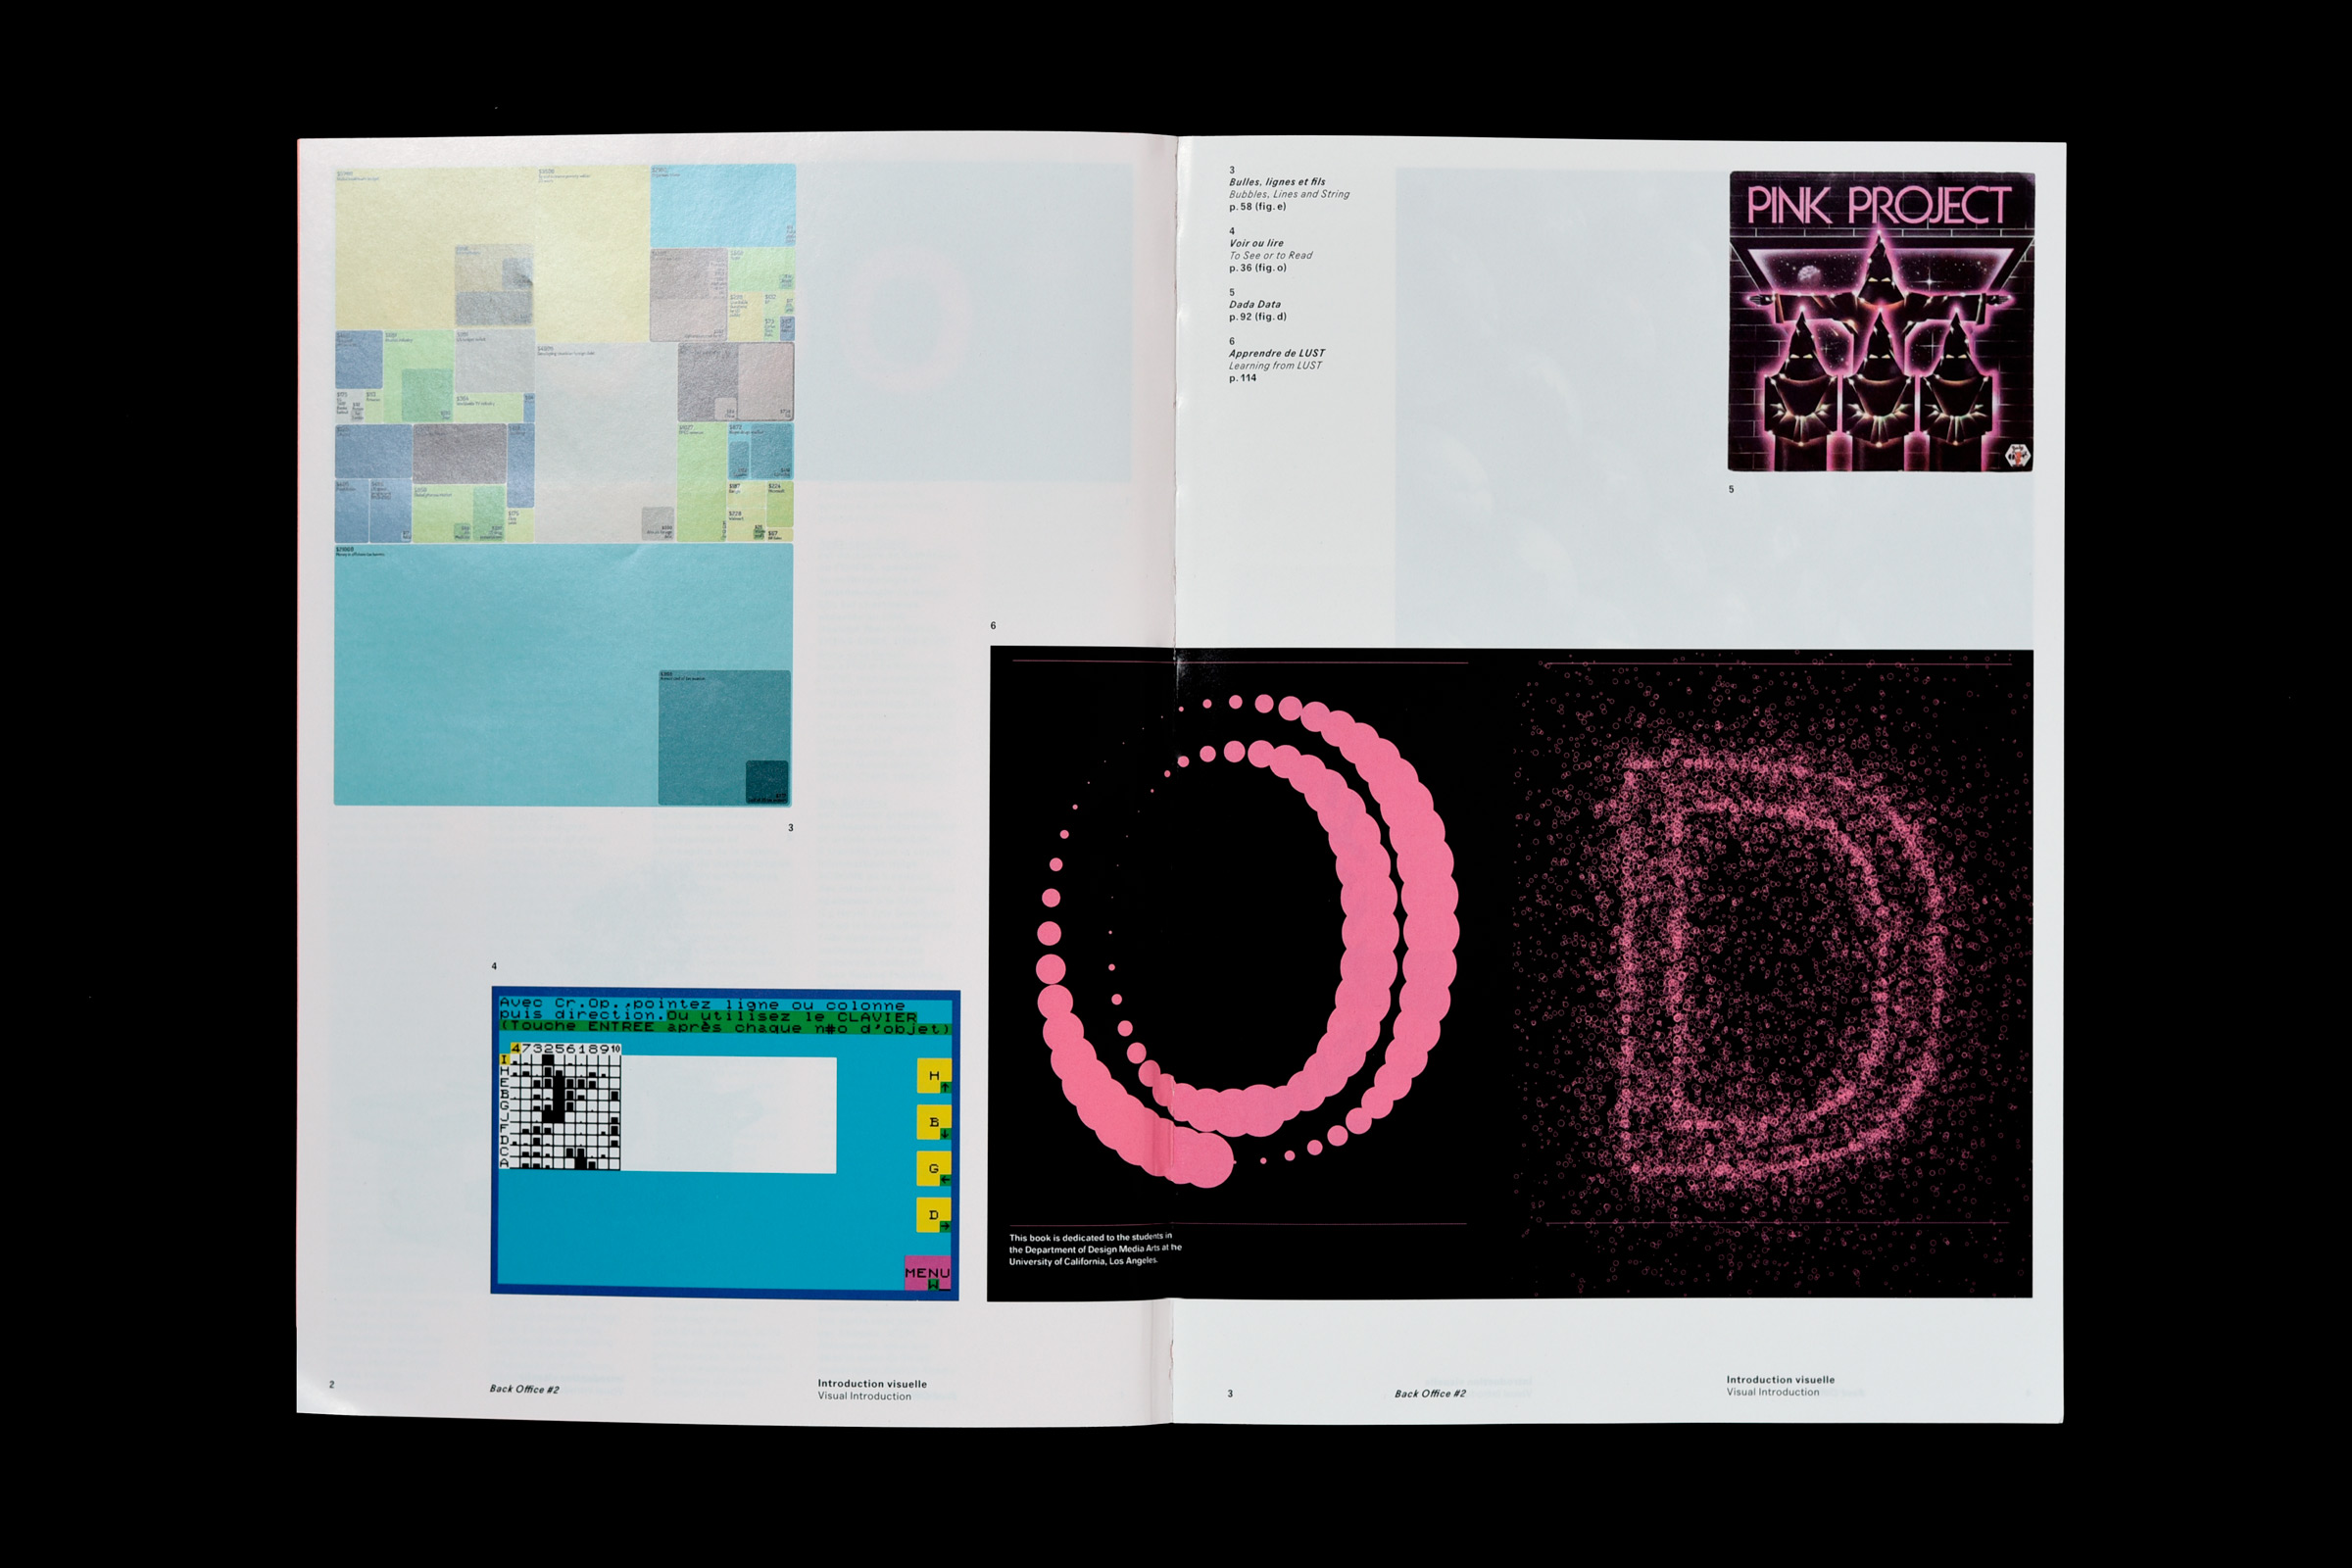
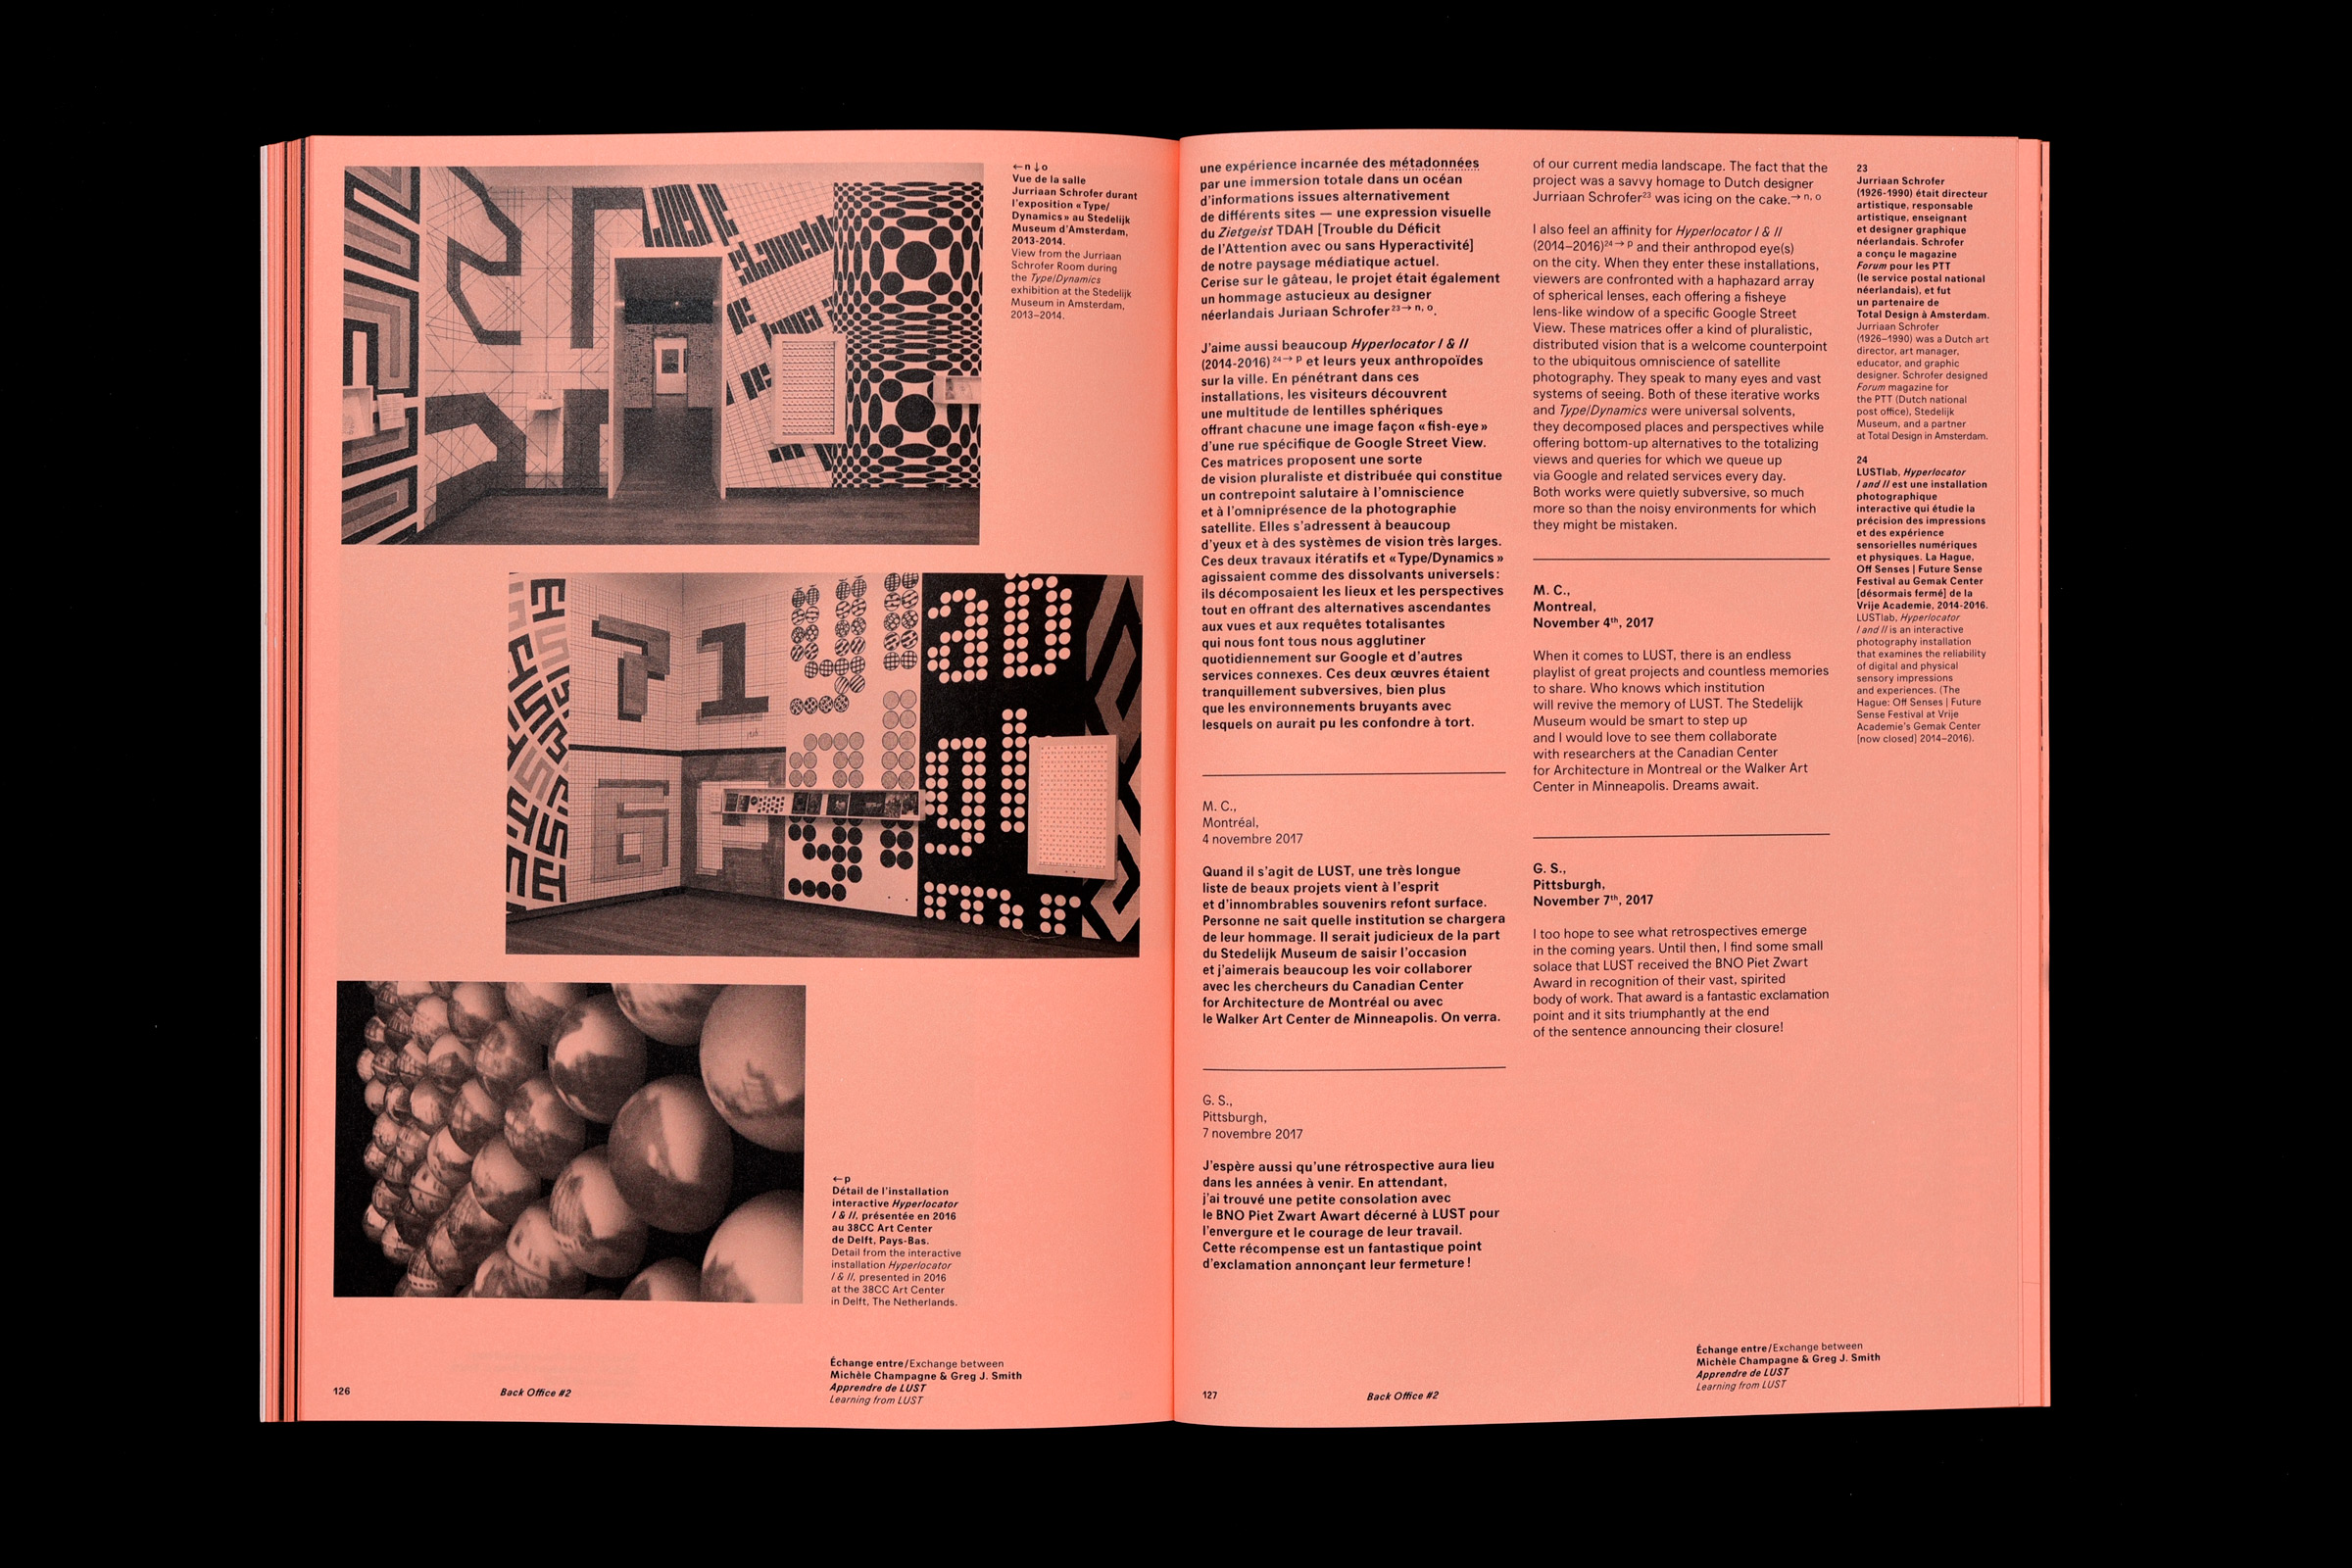
Apprendre de LUST : miroirs et folie numérique
échange entre Michèle Champagne & Greg. J. Smith
Suite à la dissolution du studio néerlandais LUST, fondé en 1996, Michèle Champagne (designer) et Greg J. Smith (éditeur), se remémorent, sous forme épistolaire, l’aventure de Jeroen Barendse, Thomas Castro et Dimitri Nieuwenhuizen. Alliant projets initiés et commandes de grandes institutions culturelles, LUST a fait le tour du monde avec des travaux singuliers alliant environnements numériques et physiques.
Transmissions de données
par Sandra Chamaret & Loïc Horellou
Le traitement et la représentation de données demandent des compétences variées, de la conception visuelle à la programmation en passant par la statistique et le design d’interaction. Comment transmettre ces expertises diverses dans des formations toujours plus spécialisées ? Sandra Chamaret et Loïc Horellou, enseignants à la Haute école d’arts du Rhin (HEAR), dressent ici un panorama de contextes d’enseignement singuliers, à même de sensibiliser les étudiants aux enjeux d’un champ protéiforme.